Published James Diekmann on October 25, 2017
Dilution IS the Solution
Recently, Jack Cochran posted “Dilution Is Not Always The Solution: The Impact of Makeup Gas Pressure For A VUV Detector For GC” and I wanted to take this opportunity to highlight an example where dilution is the solution.
Let’s briefly review the purpose of makeup gas and how it works. The Vacuum Ultraviolet (VUV) detector uses a “transparent” gas (usually Nitrogen, but Helium or Argon can also be used) to sweep analytes through the flow cell, both to maintain good chromatographic peak shapes and to keep the flow cell clean. Typically, very low makeup gas pressures (MGPs) are used (e.g., 0.25 psi, which is equivalent to ~3 mL/min flow). In other words, as the MGP increases, the flow increases, which decreases the residence time of an analyte in the flow cell. Consequently, this reduces the peak height/peak area, i.e., the sensitivity of the instrument goes down (Figure 1).

Figure 1. The peak area (PA) depends on: the length of the flow cell (d), the flow in the flow cell (F), the absorption cross section of a molecule (∑) and the total number of molecules on column/in flow cell (Ncol). The PA α 1/F, indicating that as the makeup gas flow increases, the peak area drops.
Now, why in the world would we want to decrease our instrument’s sensitivity by increasing the makeup gas flow? Well one answer to this question is maintaining linearity. For most light spectrometers, the linear range is about 3 orders of magnitude. Similarly, this holds true for VUV spectroscopy.
So, what happens when we go above or below our linear range of detection? Examining below the linear range – we just don’t see anything because we encroach on our limit of detection. Examining beyond the linear range leads to saturation.
Before we move any further, let’s quickly define saturation. Saturation refers to the complete absorption of photons from the analyte vapor cloud in the flow cell. In other words, zero photons for X wavelength(s) are being transmitted through the gas cloud as it passes through the chamber. But have no worries, saturating the VUV detector does not harm it!
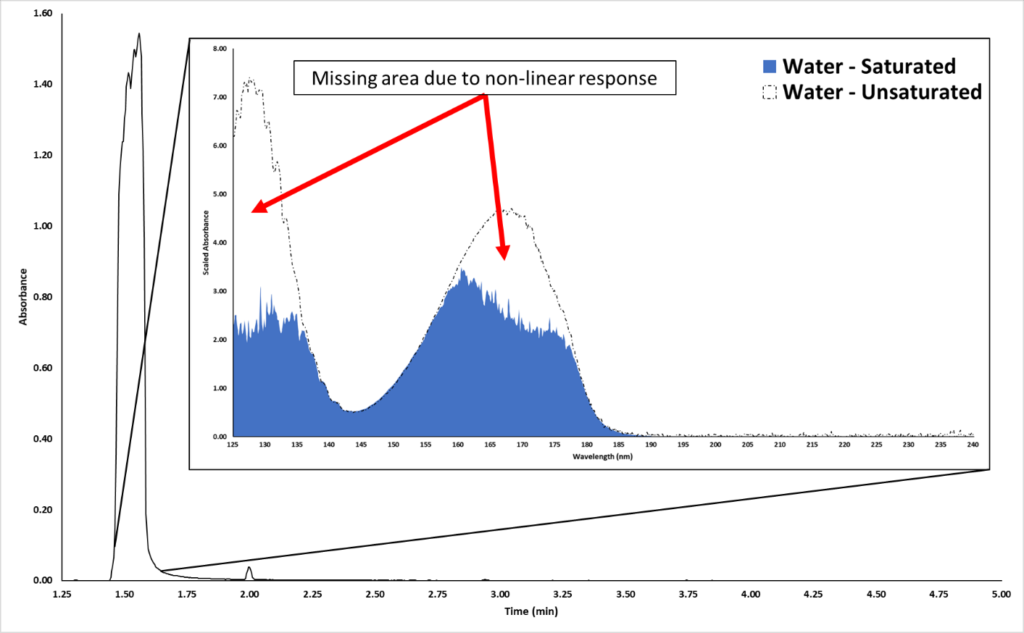
The most common occurrence of VUV detector saturation is with solvents. Chromatographically speaking, most solvent peaks are broad and fronted because they are overloaded on the GC column. Figure 2 shows an example of an overloaded water peak eluting around 1.50 minutes.

Figure 2. A water solvent peak is displayed in the chromatogram. The inset shows the obtained saturated VUV absorbance spectrum (blue). The dashed spectrum is the library spectrum for water.
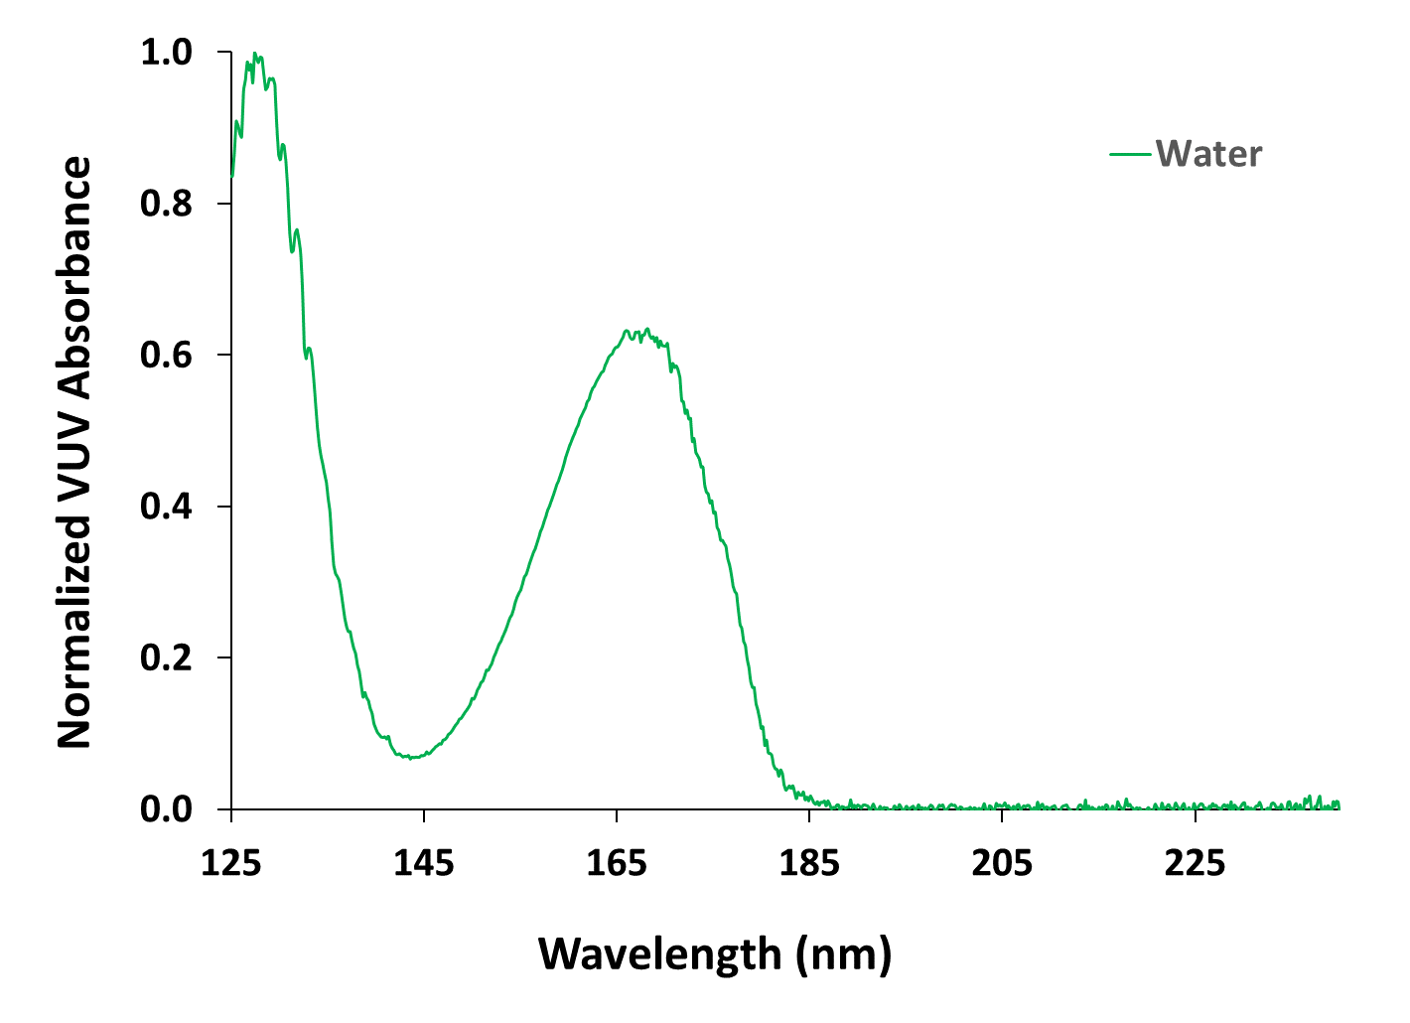
Now, what does this water peak’s spectrum look like? Going back to Figure 2, we can see from the inset plot that the acquired water spectrum (blue) does not look good. The 125-135 nm and 155-180 nm wavelength ranges have portions of the spectrum missing. The black dashed lines highlight the library spectrum, which is unsaturated. So, how do we recover the true spectral fingerprint for this highly concentrated peak? Would we reduce the split ratio or injection volume? No – that could sacrifice our sensitivity for trace compounds. Instead, we can time program the MGP from the Acquisition Method.
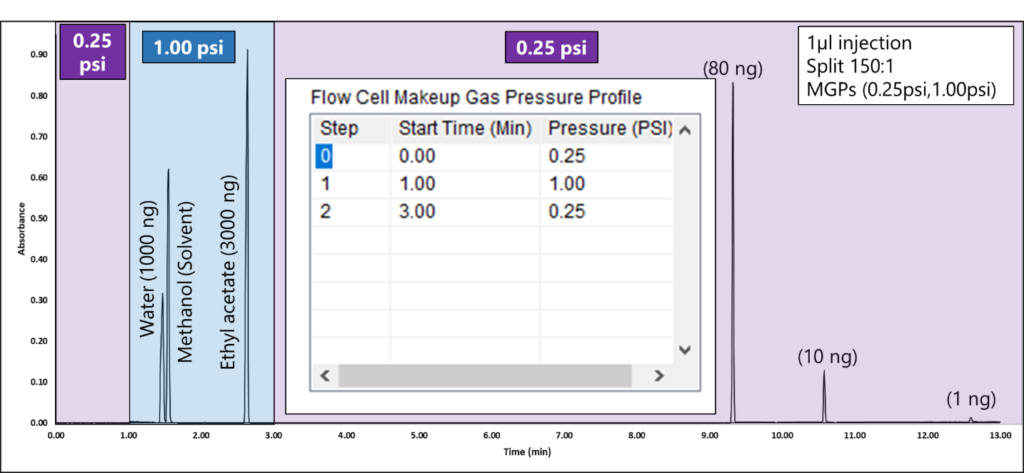
By programming the MGP, you can eliminate saturated spectra for high-concentration peaks. Figure 3 shows a real-life example of balancing solvents and maintaining the sensitivity to see lower-level components with MGP control. Notice how we are able to see a 3000 ng peak with MGP at 1.00 psi and still see a 1 ng peak with a MGP at 0.25psi. Chromatographically, the peak shapes for these solvents are ideal!

Figure 3. A MGP of 1.00 psi from 1-3 minutes prevents water, methanol, and ethyl acetate solvent peaks from saturating so they can be identified and quantified accurately. The inset plot on the chromatogram shows the MGP step program as its table in the VUV Acquisition Method. Initially, the system is set to 0.25 psi. After 1 minute, the MGP raises to 1.00 psi. To ensure sensitivity is not sacrificed for lower-level components, after 3 minutes, the makeup gas pressure is programmed to 0.25 psi, after the ethyl acetate peak elutes.
From this blog post, you can see that makeup gas pressure programming can play a key role in balancing concentration differentials, allowing for proper analyte identification and linear quantitation by avoiding spectral saturation. No change in split ratio or injection volume is required!


Leave a Reply