Published Chris Cook on October 5, 2020
The Data View window in VUVision™ Software provides a great way to quickly review run files and do a qualitative examination of the sample. This blog is the first in a series that will cover the tools for looking at the data in a run file using this window. This blog discusses what happens when a run file is loaded, how peaks are automatically identified, and how to adjust the chromatogram filters. The examples shown here use the “BAC 100 mg per dl.db” file located in the “Runs” folder of VUVision’s Demo Data folder.
Loading a run file, finding peaks, and locating background
One or more run files can be loaded in the Data View window by clicking the “Load Runs” button at the bottom of the window (Figure 1, A). The chromatogram is scanned for peaks using the first filter in the run file as the default filter. This filter is shown in the top left corner of the “Peaks” tab, where there is a drop-down menu displaying the selection for “Chromatogram Plot for Peak List”. (Figure 1, B). The Peak List table fills with information about the peaks (Figure 1, C). The chromatogram is displayed at the top of the screen using the first filter in the run file (Figure 1, D).
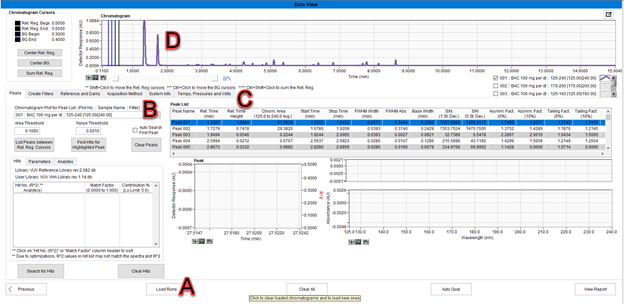
Figure 1. Information displayed when a run file first loads.
During the peak detection algorithm, VUVision keeps a list of chromatogram sections that do not have a peak and uses these sections as background. When valid peaks have been found, the nearest background section is selected for each peak. The background region is used as a baseline when measuring the absorbance in the peaks.
Peak search with a different filter
In the “Peaks” tab, the “Chromatogram Plot for Peak List” can be changed to use a different filter. When this selection is changed the “Peak List” table will clear. The retention region cursors (black) should be positioned to bracket all peaks of interest, and “List Peaks between Ret. Reg. Cursors” can be clicked to regenerate the Peak List with the new filter. (Figure 2)

Figure 2. Parameters for adjusting the Peak Search.
Some other options for controlling the search for peaks in the chromatogram are the following:
- “Area Threshold” is the minimum chromatographic area for peaks to appear in the Peak List.
- “Noise Threshold” is the minimum peak height for peaks to appear in the Peak List.
- Selecting “Auto Search First Peak” will make VUVision automatically do a spectral search for the first peak in the peak list after the chromatogram is scanned for peaks.
- “Find Hits for the Highlighted Peak” has the same function as double clicking a peak in the Peak List and does a search for spectral matches of the highlighted peak.
- “Clear Peaks” clears results in the Peak List.
Adding custom filters to the Chromatogram
Filters other than those selected in the original run file can be used as well. In the Create Filters tab (Figure 3) you can create additional filters. Addition, subtraction, multiplication, and division can be done to combine filters. Once created, these filters can be selected in the chromatogram and used to create peaks lists.
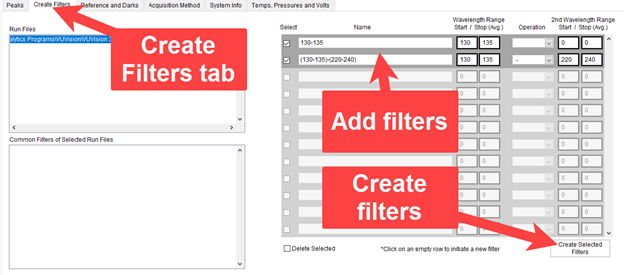
Figure 3. Create Filters tab.
Peak List Table
The Peak List shows information on all the peaks found using the peak search algorithm. The columns in the Peak List table displays the following values:
- Peak name: Peak names are given based on the elution order of the peaks.
- time (min.): Time of the maximum height of the peak
- time Height: Absorbance value at the maximum height of the peak.
- Area (): The area underneath the peak in the chromatogram with the given filter.
- Start time (min): Time of the beginning of the peak (beginning of retention region).
- Stop time (min): Time of the end of the peak (end of retention region).
- FWHM Width (min): Full width at half maximum of the peak in minutes.
- FWHM Abs: Absorption at the half maximum.
- Base width (min): Time elapsed between the beginning and end of the peak.
- S/N (1 St. Dev): Signal to noise ratio at 1 standard deviation of the noise.
- S/N (5 St. Dev.): Signal to noise ratio at 5 standard deviations of the noise.
- Fact. (5%): The asymmetry factor at 5% of the peak height. This asymmetry factor is calculated with As=B/A, where A is the length of time from the time of the leading edge at 5% height to the time of the max peak height, and B is the length of time from the time of the max peak height to the time of the trailing edge at 5% height.
- Fact. (10%): The asymmetry factor at 10% of the peak height. This is calculated as described above with the leading and trailing edge times corresponding to 10% of peak height.
- Tailing Fact. (5%): The tailing factor at 5% height. This is calculated as Tf=(A+B)/2A, where A and B are the same values described in the asymmetry factors.
- Tailing Fact. (10%): The tailing factor at 10% height. This is calculated as Tf=(A+B)/2A, where A and B are the same values described in the asymmetry factors.

Figure 4. Peak List Table
Left clicking once on the peaks in the Peak List table (Figure 4) positions an indicator in the chromatogram above the selected peak. The cursors for the background region (blue) and retention region (black) are also moved to the selected peak. (Figure 5)
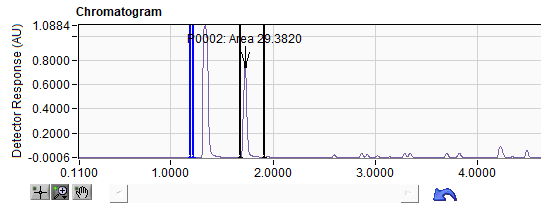
Figure 5. Peak identified in chromatogram.
Exporting Data from the Chromatogram and Peak Table
The chromatogram data can be exported for processing in other applications. This is done right clicking in the Chromatogram window and selecting Export. Output options include Excel, CSV, CDF, and the clipboard. The Peak List data can be exported to Excel or the clipboard by right clicking anywhere in the Peak List.
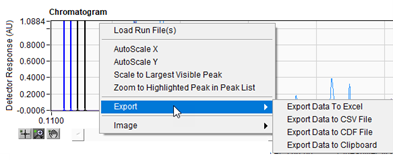
Figure 6. Exporting data from the Chromatogram plot.

Figure 7. Exporting data from the Peak List.
So far, we have examined the ways chromatograms can be constructed by looking at the run files with different filters, but that of course is only the beginning of the data in the run file. In our next post we will discuss all the spectra matching capability that makes VUV data so great. Stay tuned!



Can you elanorate on significace of knowing various factors in this? How those are usedful in data processing/validation?
Hi Ashish, thanks for the question! The Data View window has good tools for getting an overview of a particular run file, having a qualitative look at what is in the sample, and troubleshooting issues with the run. If you want to use only chromatogram data (not doing any sort of spectra fitting) for your data processing, you can get that out of chromatogram data in the Data View window. You might want to do this if you were certain about the separation in your chromatography and just wanted to use the detectors response with a given filter. However, to use the spectra fitting capabilities of VUVision for quantitation, you would need to set up a peak table and quantitation method for your sample. This is described in the VUVision software manual, and if you are interested I would be happy to send you more information.
Thanks for the explanimg in depth.