Published Chris Cook on December 10, 2020
In my last two blogs we discussed using VUVision’s Data View window to look at chromatograms and spectra in run files. This blog will cover the tools that allow you to look at some of the other data that is collected in the run files. These tools are particularly helpful when there is a problem with the acquired data and you are looking to identify a cause.
References and Darks Tab
The References and Darks tab shows the scans taken at the beginning of each run. An example reference scan (blue) and darks scan (red) are shown in Figure 1.

Figure 1. Refence scan and darks scan.
Before collecting any absorption data, VUVision first acquires a “Darks spectrum” and a “Reference spectrum”. The Darks spectrum is the response of the detector with the shutter closed (and no light on the detector). The Reference spectrum is the detector signal with only the lamp signal and no analytes in the flow cell. These two values are used to calculate all absorbance spectra in the run by the equation
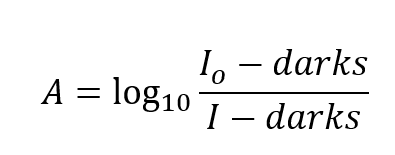
where A is the measured absorbance at any point during the run, I is measured intensity at that time, I0 is the Reference signal, and darks is the dark spectrum.
The spectrometer detector in the VGA is a 14-bit CCD (charged-coupled device) detector, and the signal saturates at 16,383 counts. The maximum point in the reference signal should be at ~161nm. The maximum signal should be above 10,000 counts but not saturating. A lower reference signal gives a poorer signal to noise ratio, and data acquisition can give inconsistent results if the signal is below ~8000 counts.
The darks signal should be a mostly flat line around 170 counts for an instrument operating at 275°C. For instruments operating at higher temperatures (as VGA-101s are able to) the darks spectrum will have higher counts in the longer wavelengths due to the thermal radiation from the much hotter flow cell. Figure 2 shows the darks signal of an instrument operated at 275°C (orange) compared to the darks scan of an instrument operated at 425°C (black).

Figure 2. Darks scans. Scan at 275°C (orange) and 425°C (black).
Acquisition Tab
The acquisition method tab (Figure 3) shows the settings in the acquisition method. The scan frequency from the run is shown here, which might be of interest if looking at VUV Analyze™ Software results and getting an expectedly high or low response from the instrument throughout the entire run. This might be something to look at if setting up the D8071 PIONA method and failing the VUV-1 benzene response. The makeup gas pressure(s) settings in the acquisition are also shown in this tab. If included in the acquisition method, the GC settings can be referenced here as well.

Figure 3. Acquisition tab showing Acquisition Frequency, Makeup gas pressure, and GC method information in VUVision
System Info Tab
The System Info tab shows data recorded about the configuration of the instrument, such as the instrument and lamp serial numbers, the lamp hours, and wavelength calibration coefficients. This information might be of interest to confirm the identity and configuration of the instrument on which the data was collected.

Figure 4. System Info Tab showing the Instrument Serial Number, Lamp Hours, and Wavelength Calibration in VUVision
Temperatures, Pressures and Volts Tab
The Temps, Pressures, and Volts tab can be used to display all the sensor readings acquired during a run. If there are unusual features seen during the run, such as unexpected small peaks in the chromatogram or baseline drift, the sensor readings can be examined to look for possible causes. For instance, spikes in the system gas pressure can result in visible peaks seen in the chromatogram, particularly if nitrogen is used for the VGA system gas. An example of chromatogram from a lab with strongly negative pressure is shown in Figure 5. Changes in pressure in the room caused spikes in the regulated pressure and system gas pressure, which then caused peaks to appear in the chromatogram baseline.
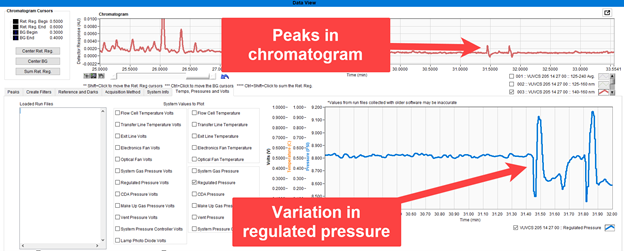
Figure 5. Sudden changes in atmospheric pressure appearing in chromatogram baseline.
Similarly, quick changes in ambient temperature can affect spectrometer temperatures and lead to a drift in baseline, as discussed in a previous blog (Baseline Issues in VUV Analyze Applications blog).
This concludes the blog series on how to use the VUVision Data View window, a great tool for looking at the raw data in a run file. For data processing, you would want to use VUV Analyze Software or setup a Quant method in VUVision. Data View is a great way to get an overview of what analytes are present in a run and to try to identify the cause of any issues. Have any questions or comments? Please leave a comment below or email support@vuvanalytics.com. Thanks for reading!



Leave a Reply