Published Chris Cook on October 27, 2020
In my previous blog we discussed the how to look at chromatograms and peak lists in the Data View Window. In this blog we will cover how the library search functions perform the searches and how to adjust the search parameters. The examples shown use the “BAC 100 mg per dl.db” file located in the “Runs” folder of VUVision’s Demo Data folder.
Manually Adjusting the Background and Retention Region Cursors
When examining a spectrum, the absorbance is calculated using a retention region (generally a peak) and a background region, which is used as a baseline when measuring the absorbance. As mentioned in the previous blog, the peak search algorithm automatically finds peaks and background regions when it creates the Peak List. It is also possible to manually select the background and retention regions. This might be done if you only wanted to look at a certain part of a peak, or if you were interested in looking at the spectrum of the baseline. The exact locations of these cursors are displayed in the top left corner of the screen in the “Chromatogram Cursors” section. The retention region (Ret. Reg) corresponds to the start and stop times of the peak, and the average of the background region (BG) is the baseline from which the absorption spectra are measured. The cursors marking these regions are displayed in the chromatogram, with blue cursors bounding the background and black cursors bounding the retention region. These cursors can be adjusted either by dragging the cursors in the chromatogram or by inputting the desired values in the Chromatogram Cursors box (Figure 1).
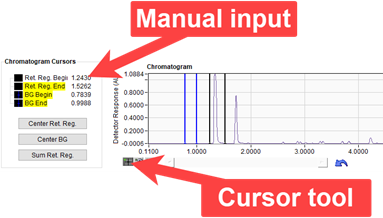
Figure 1. Adjustment of background and retention region cursors.
Library Searches
A library search is performed on the selected background and retention regions by clicking the Search for Hits button in the lower left corner of the Data View window. A search can also be done on a peak in the peak list, using the automatically determined background and retention regions, by double clicking on one of the peaks in the Peak List.
In a library search, VUVision first does a simplified search of the library for best fits, which is the “Match Factor”. With the “Max. No. of Analytes per Hit” as the default setting of zero (this value is in the “Parameters” tab and will be described below), VUVision estimates the maximum number of analytes in the peak between the “Start” and “Stop” times. It then takes the “No. of Best Analytes to Consider” and performs a tiered search on those analytes. The tiered searching begins with one analyte per hit and stops at the estimated maximum number of analytes per hit. VUVision then takes the closest matches and does a more thorough R^2 calculation to examine the difference between the acquired spectra and the combined analyte spectra obtained in the initial search. These search results are listed on the “Hits” tab, showing a list of the possible analytes (Figure 2). The list by default sorts by R^2 value, but it can also be sorted by match factor. “Contribution %” indicates the percentage of the combined spectra given by each analyte’s individual spectrum.
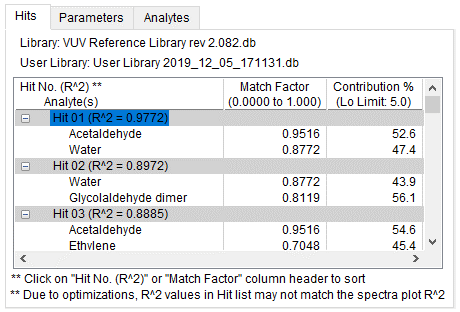
Figure 2. Results of a library search.
Modifying the Library Search
The user can change the search method used to identify hits using options in the “Parameters” and “Analytes” tabs. (Figure 3)
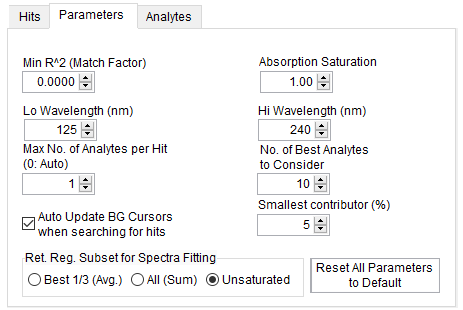
Figure 3. Search Parameters tab.
The search parameters that can be adjusted are the following:
- “Min R^2” can be increased to limit the results that appear in the list by removing matches that do not meet a certain threshold.
- “Absorption Saturation” is the level at which a spectrum is considered to have a saturated response.
- “Lo” and “Hi” wavelength settings adjust the limits of spectra used for spectral matching.
- “Max No. of Analytes per Hit” controls how many analytes VUVision uses to try to make a match. When the “Max. No. of Analytes per Hit” is set to 0 (the default setting), VUVision does the tiered search described previously. The search will force results to use the number of analytes given in “Max No. of Analytes per Hit” if this value is not 0.
- “No. of Best Analytes to Consider” puts a limit on the number of results that appear in the Hits list.
- “Smallest contributor” is the amount of an analyte must be present to be shown in the search results.
- “Ret. Reg. Subset for Spectra Fitting” determines which spectra within the peak are used for spectra fitting.
- “Unsaturated” uses those spectra in which the none of the absorption exceeds the set “Absorption Saturation Limit”.
- “All (Sum)” uses all the spectra in the peak.
- “Best 1/3 (Avg)” uses the highest 1/3 of scans in the peak. This option disregards the saturated scans unless there are not enough unsaturated scans to equal 1/3 of the total scans.
The “Analytes” tab (Figure 4) allows the user to make the search look at particular analytes of interest. If the box is checked the search will force the fit of the selected analytes.
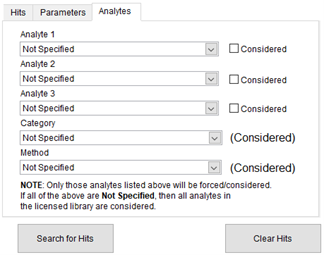
Figure 4. Analytes tab.
Peak window
The “Peak” plot shows a closeup view of the selected peak in the chromatogram, as well as the contributions of the analytes highlighted in the “Hits” tab. The R^2 of the highlighted analytes compared to the acquired spectra is also shown. Peak 4 from our demo chromatogram (Figure 5) has only ethyl alcohol present. Peak 3 (Figure 6) has both water and acetaldehyde.
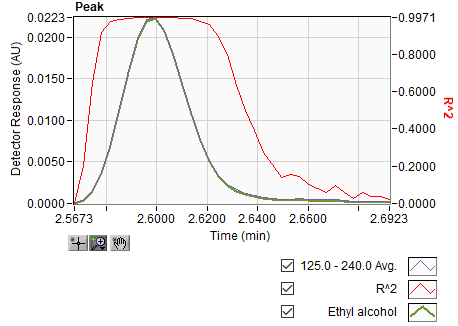
Figure 5. Peak with only one analyte.
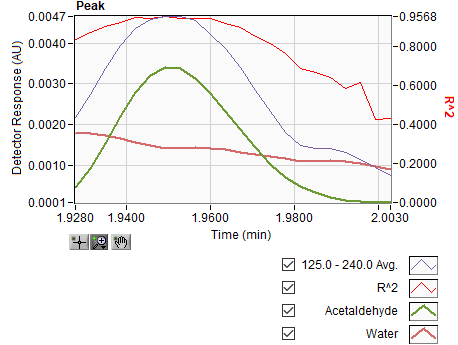
Figure 6. Peak with two analytes.
In Peak 2 (Figure 7) the signal is saturated, and above the plot “Saturated Peak” is displayed. VUVision will estimate what the peak would be if the absorbance was not saturated. The purple line in the plot below shows the actual absorbance, and the green line showing water displays VUVision’s estimation of what the signal should be. Note that the “Chrom. Area” calculated in the Peak List shows the actual area of the peak in the acquired data and does not reflect this estimated size of the peak. The “Chrom. Area” and the area used in the Post Processing window and in the HTML report might differ significantly if the peak is saturated.
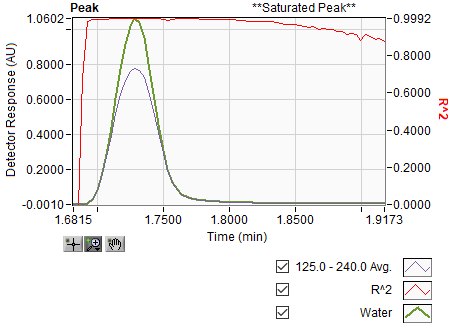
Figure 7. Saturated peak.
Spectral matching plot
The plots in the bottom right of the Data View window show the spectral matching. The spectra of Peak 3 (Figure 8) shows the individual contributions of water and acetaldehyde (contributions at the percentages given in the hits list) as well as their combined spectrum. The acquired spectrum is also shown. A plot of the R^2 of the combined spectrum and the acquired spectrum is shown above the spectra plot.
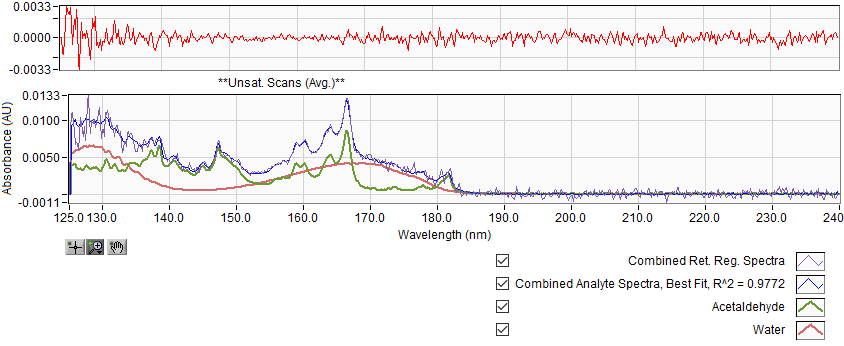
Figure 8. Spectral matching plot with two analytes in spectrum.
In the last two blogs we have covered how to look at the run file using chromatogram tools and how to look at the spectra data in the run file. Be sure to come back next time for the final blog in this series, where we will look at the system information and machine data (temperatures, pressures, etc.) that can be helpful for determining the causes of irregularities in run data.



Leave a Reply