Published Ryan Schonert on October 21, 2019
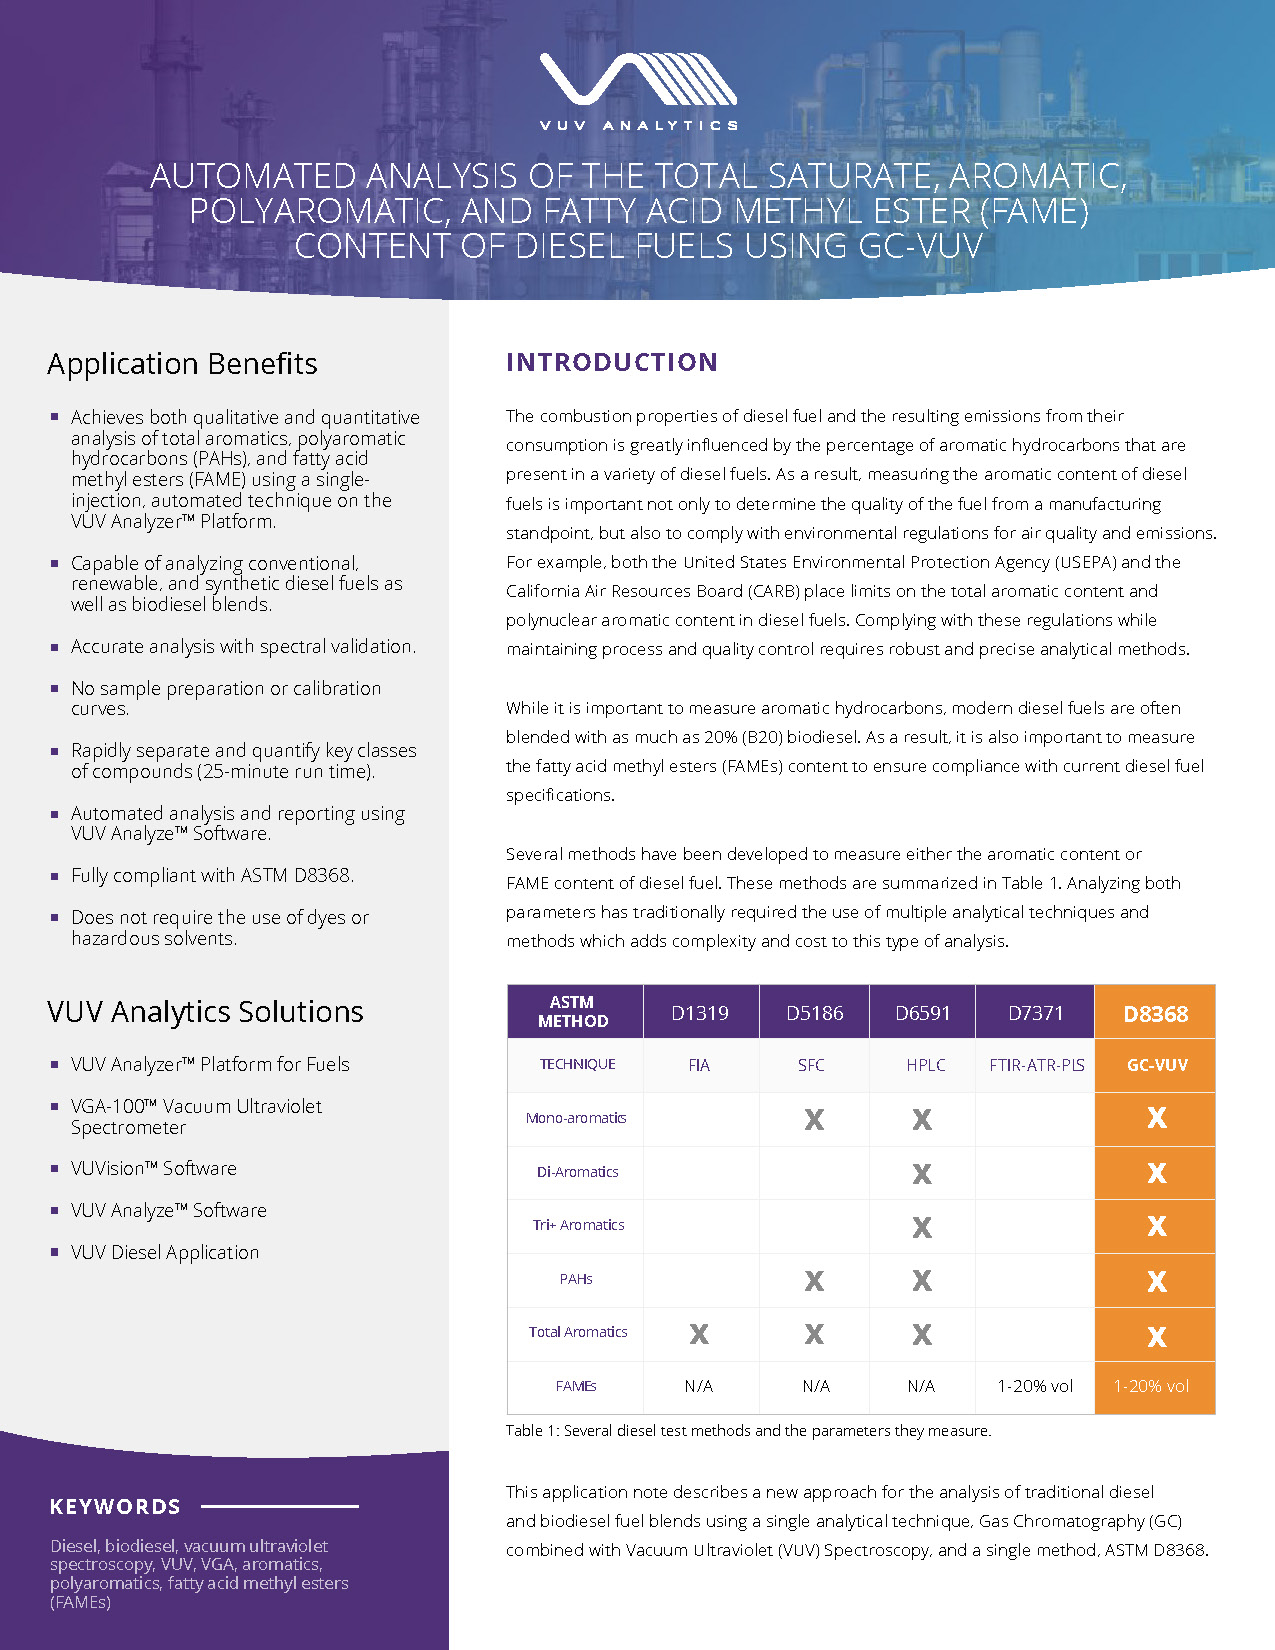
Using VUV Analyze(TM) to find specific compounds or Analytes to Include
Let’s check out another tab in R&D mode: Analytes to Include. Analytes to Include is a way of customizing how VUV Analyze searches for and matches analytes. Here, you can tell VUV Analyze to look for specific compounds in defined time ranges, and it will incorporate these extra search parameters on top of the regular analysis. You might be thinking: didn’t we already do this in Part 2? We used the Edit/Create Report Method feature to do a D8071 PIONA analysis while simultaneously quantifying N-methylaniline, a harmful additive found in some gasolines. Wasn’t that the same thing?
Well…not quite. VUV Analyze uses spectral matching to identify peaks; however, to increase accuracy, VUV Analyze compares the calculated retention index (RI) of the peak to the RI values of the compounds in the library, and only compounds with similar RI values are considered for identification. The RI values included with the PIONA library are standard non polar values, which are determined using 100% PDMS columns. However, what if your analysis uses a different column, such as a 65% PDMS / 35% phenyl column? In this case, the RI values in the library wouldn’t be valid. Instead, if you know where your analytes of interest are eluting, you can tell VUV Analyze to search for a specific compound within a defined time range. Therefore, unlike calling out analytes with the Edit/Create Report method feature, Analytes to Include can be used to quantify specific compounds regardless of the analysis conditions.
We’ve even used this feature in the early stages of developing our VUV Verified Hydrocarbon Analysis(TM) (VHA). Since VHA is operated on a 100% PDMS column, the library’s RI values are still valid, but we can increase quantitative accuracy for individual compounds by restricting their time windows in the Analytes to Include list. Be on the lookout for our VHA method, coming soon to a lab near you! You can also register for our upcoming VHA webinar to learn more about this specific application. Until then, here’s an “under the hood” look at our early VHA method development in Figure 1.
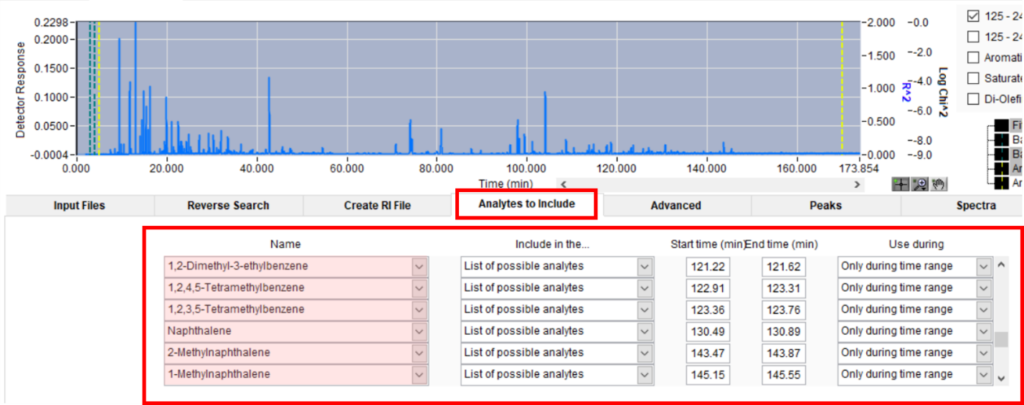
Figure 1. Snapshot of the Analytes to Include portion of our VHA method, which has Start/End times entered for each compound we were interested in. Specifying the Start/End times increases the accuracy of peak identification.
At VUV, we also use this feature to inspect instruments in our lab and at customer sites. One thing we look for is system reactivity, which could be caused by an air leak near the flow cell or transfer line. To test for reactivity in the system, we use VUV-CS, a standard gasoline containing approximately 10% ethanol. In a reactive system, some of this ethanol will convert to acetaldehyde before detection in the flow cell. Therefore, we need to use Analytes to Include to look for acetaldehyde in the ethanol peak since acetaldehyde would normally elute before ethanol if it was already present in the sample. Figure 2 shows a sample analysis looking for acetaldehyde.
a.

b.
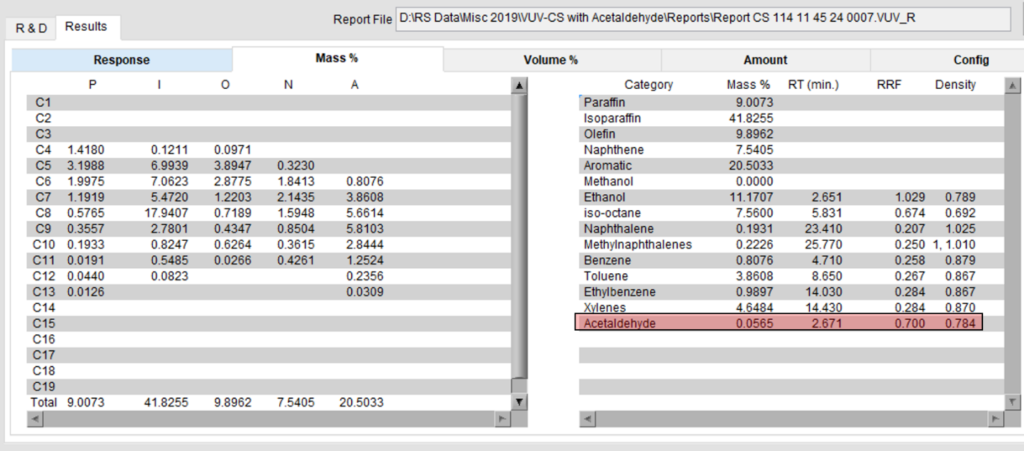
Figure 2. a) Analytes to Include settings for acetaldehyde. In reactive systems, the ethanol in gasoline will convert to acetaldehyde. Normally, acetaldehyde elutes before ethanol; however, in a reactive system, any acetaldehyde formed will elute with the ethanol. Therefore, we must tell VUV Analyze to look for acetaldehyde during the time range when ethanol is eluting. b) Analysis results of VUV-CS in a reactive system. The presence of acetaldehyde means that some ethanol was converted to acetaldehyde, indicating system reactivity.
One thing to note: if you use Analytes to Include, you’ll still need to edit your report method to display individual items or categories you’re interested in reporting. For example, in our analysis of VUV-CS looking for acetaldehyde, I use a custom report method that includes acetaldehyde.
There are plenty of other facets about VUV Analyze that I won’t cover here, but this software is something I use on a regular basis, and it’s made my data analysis a very easy task. Once you get to know the software, VUV Analyze is a workhorse that will make your job a whole lot easier!
Have any questions about VUV Analyze Software, or are there features you wished it had? Let us know by emailing info@vuvanalytics.com or commenting below.




Leave a Reply