Published Jonathan Smuts, VUV Analytics on September 8, 2017
“Μην αφήστε κανέναν άγνονα της χρωματογραφίας να εισέλθει εδώ” (“Let no one ignorant of chromatography enter here”)
Well, just to get it out in the open at the onset, the header is a spoof on what is speculated to have been engraved above the door to Plato’s academy: “Let no one ignorant of geometry enter here.” While anyone may read these blogs if they so wish, it is unlikely it will profit someone who is ignorant of chromatography. So, abandon all band broadening ye who enter here!
Response factor (RF) is defined as the ratio between the concentration of an analyte and the detector response, which in chromatography is usually based on peak area. When we use a range of analyte concentrations, the response factor comes from the slope of the linear calibration curve. In short, RFs are used to quantify a jumble of qualitative, chromatographic peaks.
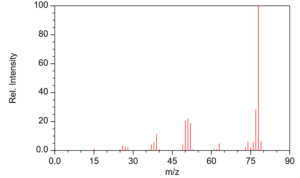
Detectors like FID and TCD have a single RF per analyte while element-selective detectors like AED, SCD and NCD have a single RF for molecules bearing the given element (this is sometimes referred to as a unimolecular response). Spectral detectors, for want of a better word, like MS, VUV and FT-IR, can have more than one response depending on what part of the spectrum is being used. In MS, for example in determining benzene, one might focus on m/z = 78 using selected ion monitoring (SIM, an acquisition function) or by plotting the 78 m/z charge (extracted ion chromatogram, EIC) from full scan work, rather than the total ion chromatogram (TIC) – TIC and 78 peaks will have different RFs for the same analyte concentration (Figure 1).

Figure 1. Electron ionization mass spectrum for benzene.
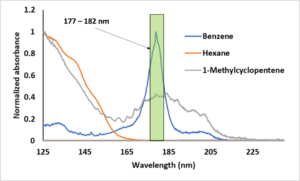
In GC- vacuum ultraviolet (VUV) absorption spectroscopy, we have the same flexibility. The VUV analog of SIM or EIC modes in MS is called spectral filtering. The use of spectral filters is a VUV software feature where we plot a region of the full wavelength spectrum. Thus, after collecting default, full wavelength spectra, we might opt to plot 125 – 160 nm for highlighting aliphatics, 170 – 200 nm for highlighting unsaturates (e.g., monoaromatics) and 200 – 240 nm for highlighting conjugation and diaromatics (Figure 2). Thus, in the case of benzene, if we wanted to optimize the S/N like we do in GC-MS using m/z = 78, we would use a spectral filter that focuses on the lambda max of benzene, e.g., 177 – 182 nm (Figure 2).

Figure 2. The VUV spectrum for benzene.
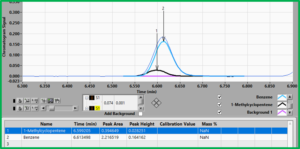
Lastly, in the case of the well-known co-elution of benzene and 1-methylcyclopentene, Figure 2 shows that both compounds have common regions for RF, i.e. we cannot find a unique RF for each compound like we could for hexane and benzene. Thus, if we applied our experimentally determined RF for benzene to this case of co-elution, we are going to over report the amount of benzene. Here, it behooves us to make use of the elegant deconvolution capability of VUV and apply the RF after the fact. Since these spectra are very distinct, deconvolution would be very simple and the RF will be applied to, in effect, to two distinct peaks (Figure 3).

Figure 3. The deconvolution of 1-methylcyclopentene (1, black peak) and benzene (2, blue peak) is easily accomplished by using their unique absorbance spectra.


Leave a Reply