Published Ryan Schonert on September 28, 2018
Efficient PIONA Analysis with VUV Analyze PIONA+™
When I was in school taking various chemistry classes, we’d often do things the hard way to serve as a learning experience. For example, if I wanted to run samples on a new GC column with different dimensions, I’d have to translate my GC method using a pen and paper rather than an automated method translation program. To be sure, these were great learning experiences, but in the working world, time is money. When you’ve got too many things to do and a small amount of time to do them, being efficient in the lab is incredibly important.
Since I’ve joined VUV Analytics, I’ve been learning about all the ways GC-VUV can save you time, and one of the most impressive examples is PIONA data analysis. To maintain quality assurance standards, oil refineries characterize gasoline samples for their content of paraffins, isoparaffins, olefins, naphthenes, and aromatics (PIONA). As I mentioned in Part 1, PIONA analysis is traditionally performed using GC-FID per ASTM D6730-01, but GC run times can be drastically reduced using GC-VUV per ASTM D8071-17. Saving an hour or two for the GC run is great, but what about the time spent processing the data after the samples are analyzed? Can we shorten this time as well? As it turns out…yes! Instead of sitting down and characterizing each peak by hand, we can use the VUV Analytics tool designed to make PIONA analysis a breeze: VUV Analyze PIONA+™. With this software, you can load your GC-VUV run, hit go, and have your results in under 30 seconds! Figures 1-3 give a glimpse at the process.
Once processing is finished, quite a bit of data is generated. Using spectral and retention index matching, VUV PIONA+™ quickly identifies and classifies the compounds in the sample. Qualitatively, these results can be seen in Figure 2 where each peak is shaded with a color corresponding to its class. Quantitatively, the Beer-Lambert law, along with compound response factors and densities, is used to calculate values as Mass % and Volume %, as shown in Figure 3. All of this data was obtained with only a few button-clicks and about 30 seconds of automated data processing time!
Don’t forget: in the working world, time is money. VUV PIONA+ paired with GC-VUV can get you there faster!
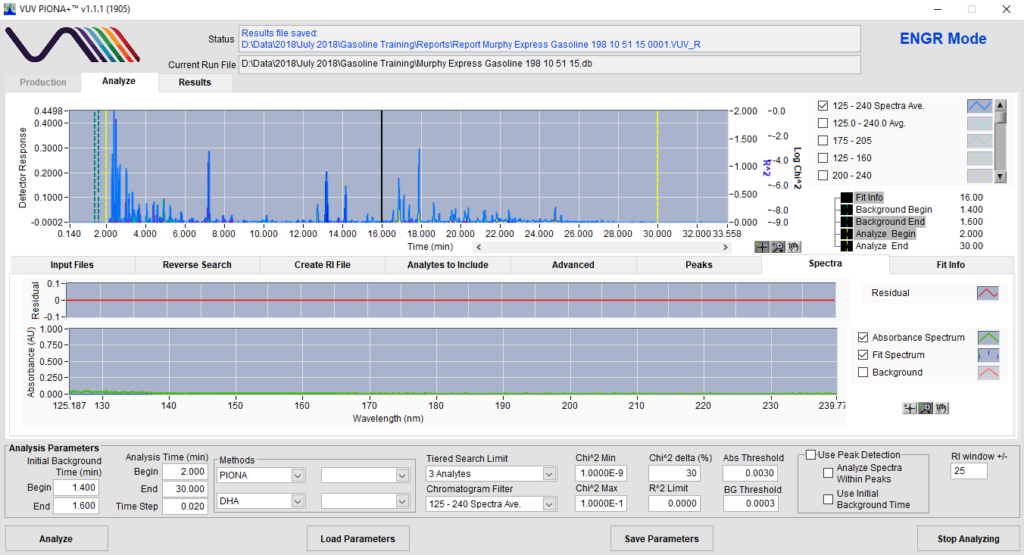
Figure 1. ASTM D8071-17 GC-VUV chromatogram from gasoline processed using VUV Analyze. VUV PIONA+ identifies compounds using retention index and spectral library match, giving a high degree of accuracy in sample analysis.
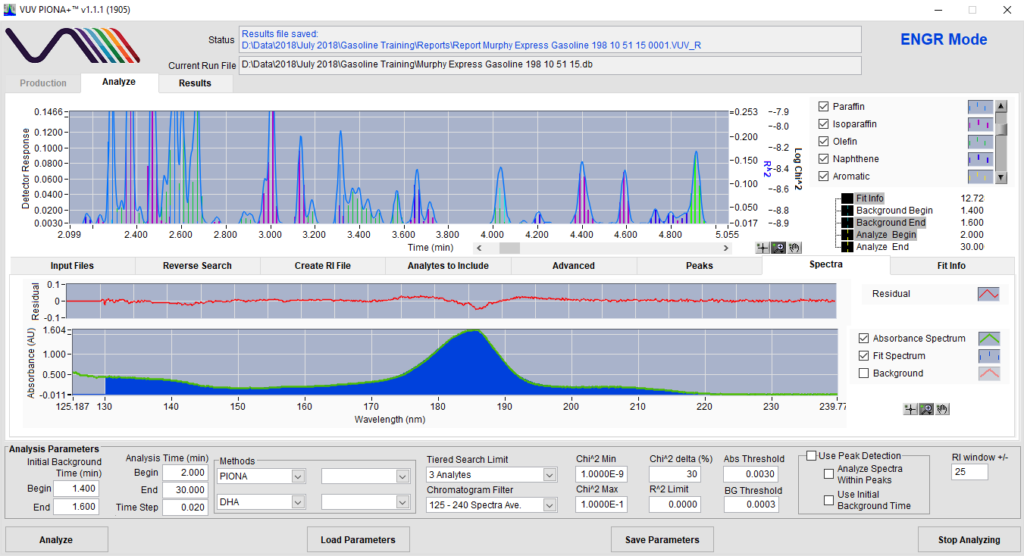
Figure 2. VUV Analyze processed gasoline chromatogram, zoomed in at 2-5 minutes. VUV PIONA+ categorizes and labels each peak based on its class, even color-coding them for easy distinction. Spectral matching can be observed in the bottom portion of the screen, shown by the observed spectrum (blue) and the library spectrum (green line).
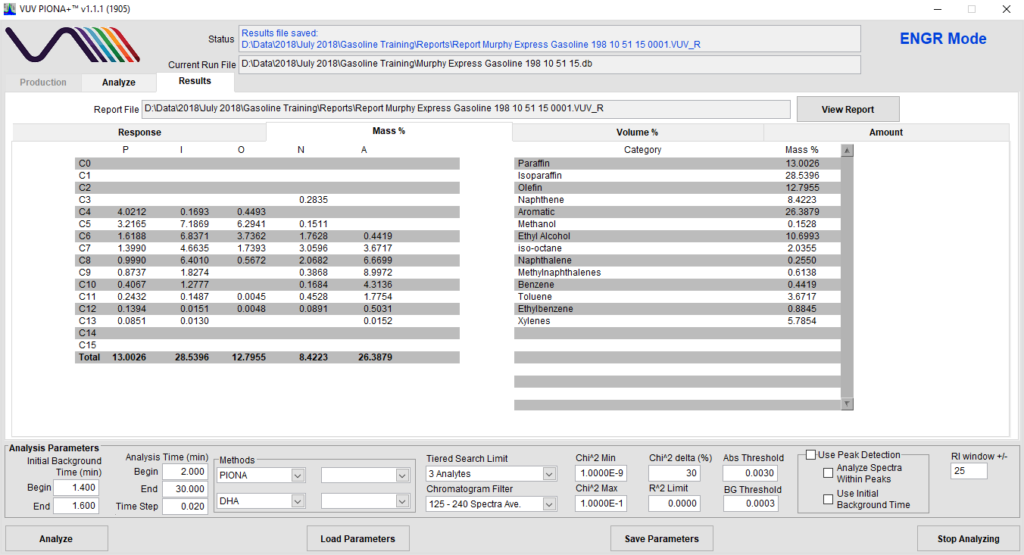
Figure 3. Results for a GC-VUV gasoline sample with data processing using VUV Analyze PIONA+. Mass % and Volume % are reported for each of the PIONA categories, their carbon number breakdown, as well as a handful of individual compounds important for gasoline analysis.
Author

Ryan Schonert
Ryan Schonert is currently an Application Scientist for VUV Analytics. Prior to joining VUV Analytics, Ryan performed research on the extraction and characterization of additives in smokeless powders using GC-MS and SEM-EDS. He earned a B.S. in Chemistry from Illinois Wesleyan University and an M.P.S. in Forensic Science from the Pennsylvania State University.
Related Reading
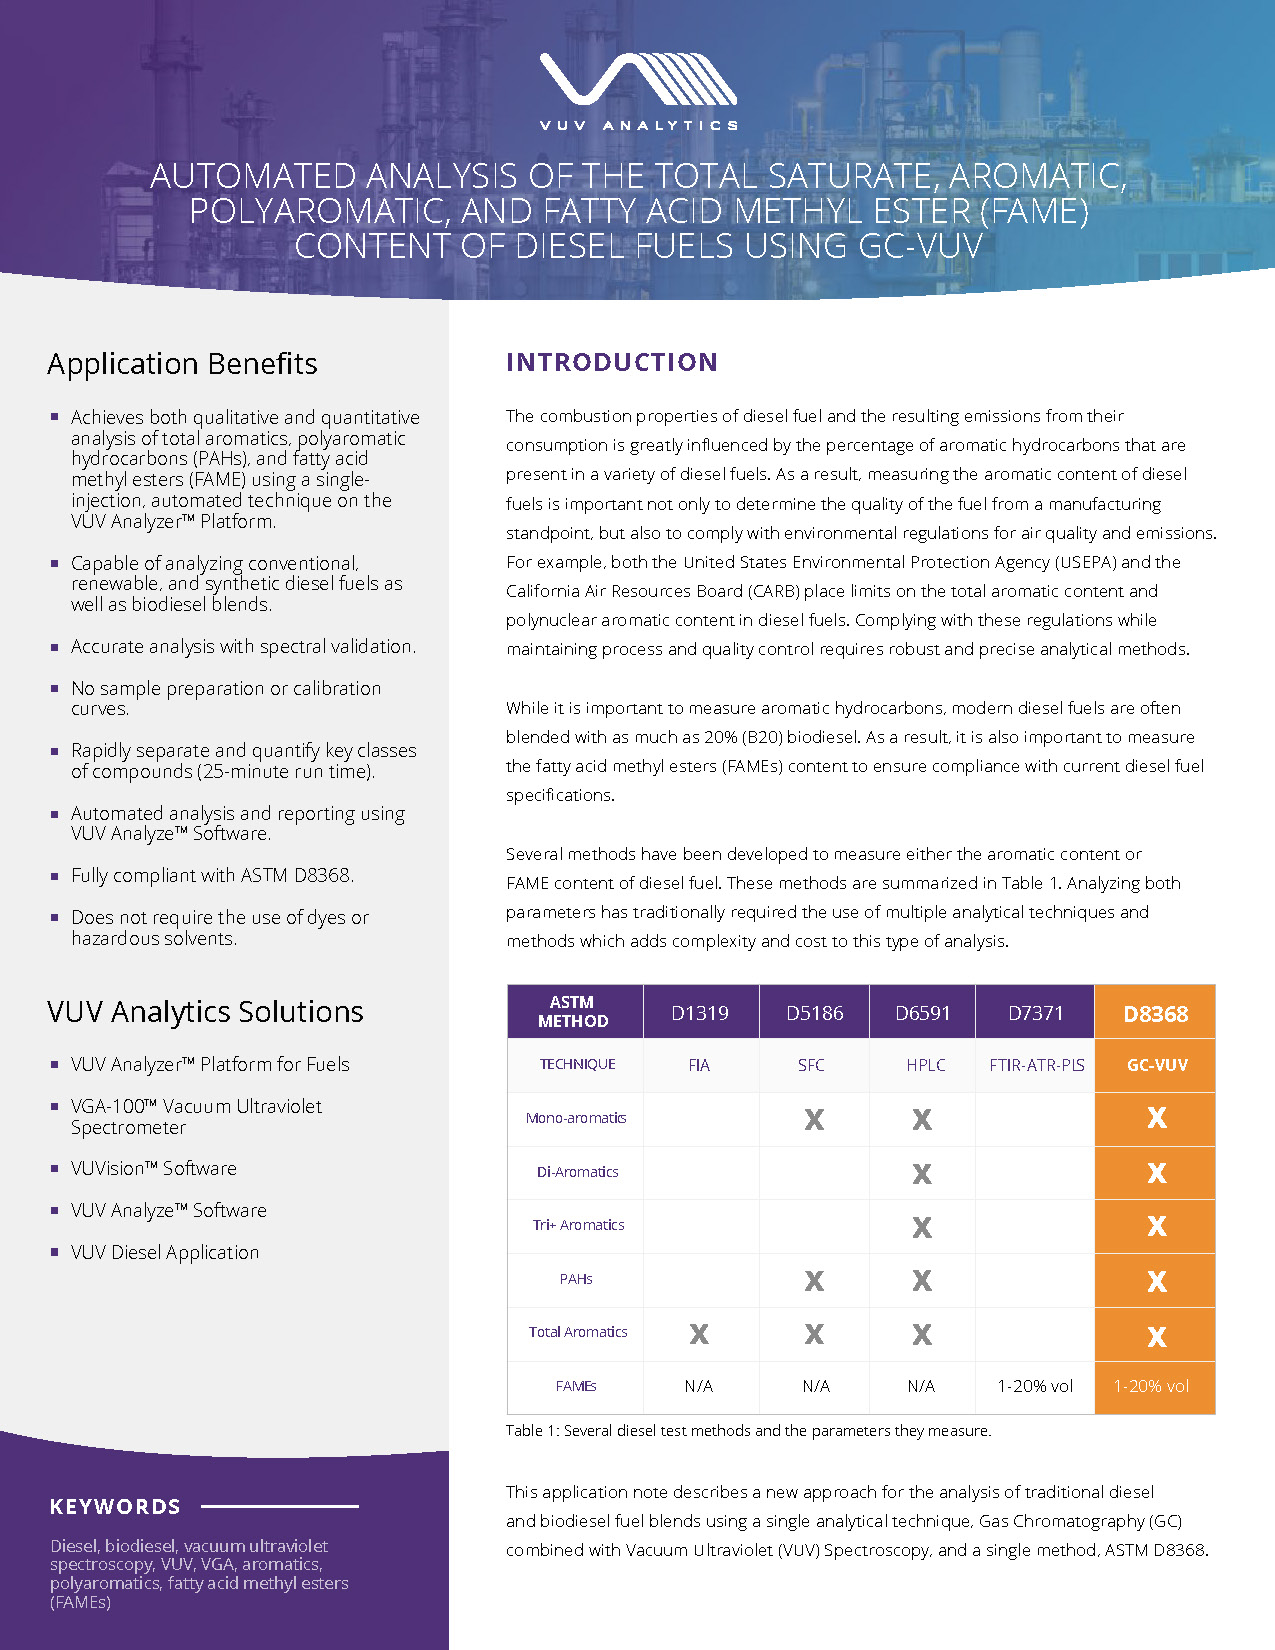
Automated Analysis of the Total Saturate, Aromatic, Polyaromatic, and Fatty Acid Methyl Ester (FAME) Content of Diesel Fuels Using GC-VUV
This is the official application note for the VUV Diesel Analyze Application using GC-VUV and…
Read More >
Standardizing Your Analysis: ASTM D8267 Standards
by Chris Cook
In this blog, we discuss the importance of all standards used in our ASTM D8267…
Read More >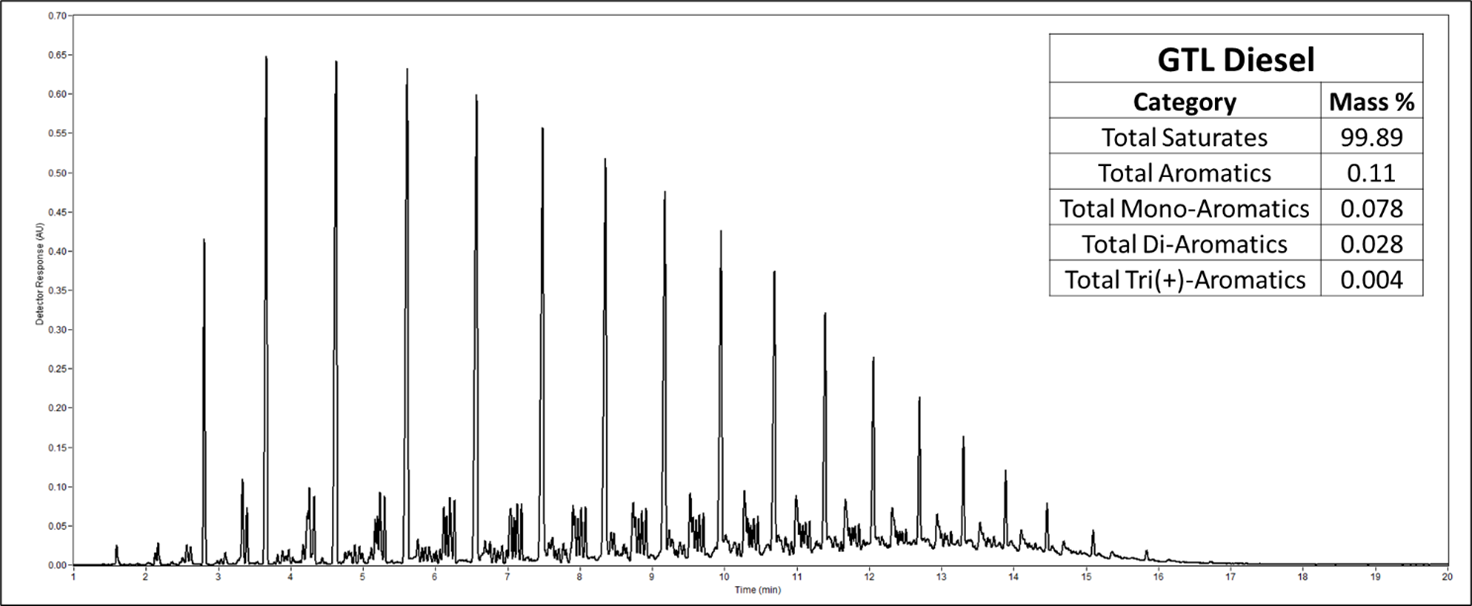
An Update on Our Diesel Method
Alex Hodgson
This blog provides an update to our upcoming diesel analysis method.
Read More >


Leave a Reply