Published Chris Hernandez on December 21, 2020
Maintaining a quality spectral library is the cornerstone of a successful analysis. For the spectral database and application libraries we develop, we have you covered. But what if you have a custom application you want to develop? What if there is an obscure compound you need to add to your library? This blog outlines what considerations must be considered when adding a compound to your user library and outlines the steps to do so.
First, a quick refresher on absorbance spectroscopy. The intensity of the VUV absorbance of an analyte can be described using Beer’s law, which means absorbance is fairly linear with respect to an analyte’s concentration. However, this linear relationship breaks down when the analyte’s concentration is too high, when almost all of the available photons at a given wavelength are absorbed. When there are enough analyte molecules in the flow cell to absorb more than ~95% of the available photons, the response will become non-linear and this can result in very distorted spectral shapes. Spectra that have this distortion shouldn’t be added to a library – this will just cause problems further down the road. In short, when adding or updating spectra to your User Library, it’s important to make sure that the spectra don’t have regions that have absorbance saturation.
Take for instance Figure 1, which shows an absorbance spectrum for benzene that has a maximum absorbance just below 1.2 AU and doesn’t exhibit absorbance saturation. Note that the small bump at the peak apex is a unique benzene absorbance feature.

Figure 1: Clean VUV absorbance spectrum of benzene.
Figure 2 shows the measured spectrum when the absorbance has increased to 1.6 AU. You can see that the bump at the peak apex is slightly distorted. It’s a subtle difference but can potentially impact your analysis.

Figure 2: VUV spectrum of benzene starting to show some non-linear effects.
And finally, figure 3 shows what is measured when the maximum absorbance is > 2 AU. The peak apex has become very distorted and that signature bump is gone.

Figure 3: VUV spectrum of benzene showing extreme non-linear effects.
Figure 4 shows an extreme case of oversaturation, this time for dichloromethane.

Figure 4: An example of a good and poor VUV spectrum of dichloromethane.
These few examples show just what may be encountered and what to watch out for when capturing spectra for your user library. It’s very important to ensure that there are no regions where the absorbance spectrum is saturated and the response has become non-linear.
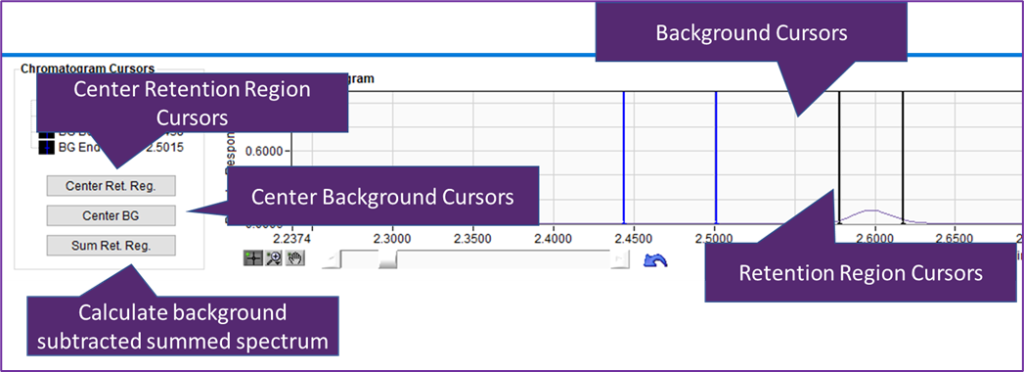
When acquiring the highest quality spectra to add to the spectral library, it is best to obtain a background-subtracted summed spectrum. Start by loading a chromatogram into the Data View window (as outlined in the previous blog post “Exploring The Data View Window In VUVision™ Software Part 1“), and then, in the chromatogram window, use the two blue vertical cursors to define a region to use as the background and the two black vertical cursors to define the region to capture spectra from. If either of these cursors are not visible, you can always click “Center BG” and “Center Ret. Reg” to bring the background and retention region cursors into view. Figure 5 points out where these can be found within the Data View window in VUVision Software.

Figure 5: Important functions found within the Data View window of VUVision Software.
When selecting the background region, there are a few items to keep in mind. The background region should be selected as close as possible to the analyte peak of interest and the absorbance spectra in this region should not have any structure (no absorbance features). The absorbance spectra should look like random noise centered around 0 AU as shown in Figure 6.

Figure 6: When capturing a background, the signal should be centered around 0 AU.
When specifying the retention region, move the black cursors to a position on the peak of interest and check its corresponding absorbance spectrum to see if it has regions of absorbance saturation. You may have noticed in the benzene example used earlier, there will be an indicator showing if the scan is saturating. If that’s the case, the retention region should be adjusted to eliminate saturation.
Move one Retention Region cursor along the peak until you find a region where the absorbance signal is just below 1.2 AU. Then move the second cursor to a location close to the first cursor. In some cases, you may be able to select a region centered about the peak apex, but if the absorbance spectra around the apex are saturated, select a region on the peak tail. Also, try not to select spectra that have a maximum absorbance below 0.3 AU. You want a range of spectra that have good S/N to sum together.
Once you have a background and retention region selected, click the [Sum Ret. Reg.] button and the software will calculate the background-subtracted summed spectrum automatically. Finally, right-click on the spectrum within VUVision and select “Send to Library Editor” where you can give the analyte a name and other details.
If you want to learn more about VUVision or VUV Analyze, check out our other blogs like the “Exploring the Data View Window in VUVision Software” series or “Rising Baseline Issues in VUV Analyze™ Software Applications”, or simply post a question below!


Leave a Reply