Published James Diekmann on July 11, 2018
Saturation and the VUV Detector
When I was a kid in the early 90s, I remember being extremely shy of cameras. Looking back at it now, I think it was because you couldn’t edit them, and taking selfies wasn’t as common. Fast forward to the digital age of 2018, and you’ll see me on Instagram often. We owe this rapid change in camera technology in part to Charge Coupled Devices, or CCDs.
My non-technical definition of a CCD is a grid of pixels or “wells” that house electrons. As light strikes the CCD array, electrons are generated and stored in potential wells. Through physics, engineering, and computer programs, these electron counts are transformed into a photograph.
As a novice photographer, I’ve learned that the amount of light hitting a camera’s CCD can drastically change the photo. Yes – an obvious observation, but what happens when too much light strikes the CCD? When a CCD is bombarded with photons, pixels can become saturated, or even worse – bloomed (Figure 1).
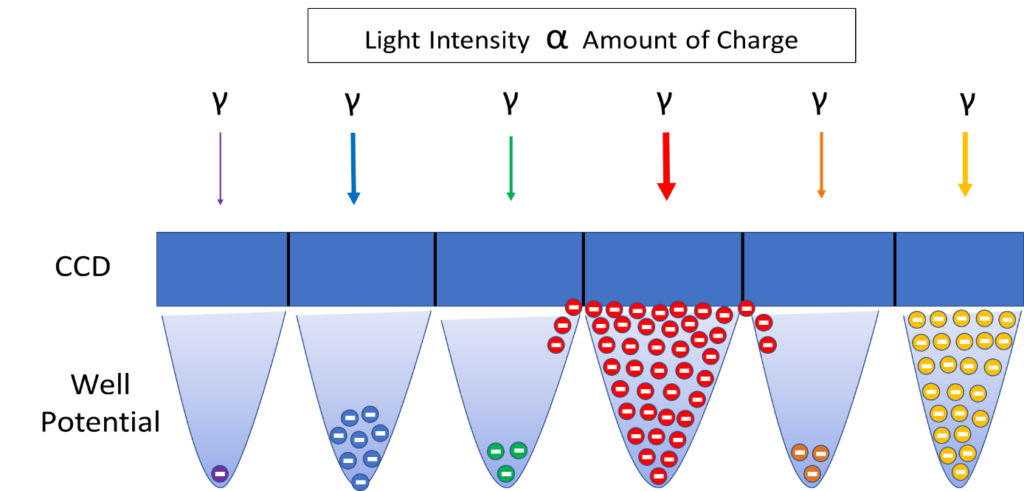
Figure 1. Depiction of a one-dimensional CCD. Electrons are generated through photon (γ) absorption and stored in potential wells. The color of light corresponds to a photon’s wavelength. The thickness of the arrow indicates the intensity of the photons. As the intensity of light increases, so do the number of electrons in the corresponding potential well. The yellow electrons represent a saturated pixel, meaning the well is at capacity for storing electrons. The red electrons represent a blooming pixel, where electrons are overflowing into surrounding wells. The blue, green, orange, and purple electrons show wells that are not at capacity.
As someone with training in astronomy, I’ll throw in an astronomical example to demonstrate pixel blooming. Figure 2 shows a CCD image of a few stars taken from the European Southern Observatory. Notice how some of the stars have long streaks. This happens when copious amounts of photons hit a pixel and too many electrons are generated and begin to spill into the neighboring ones, causing these artifacts. This is a common occurrence in astrophotography when anti-bloom technology isn’t present in a CCD.
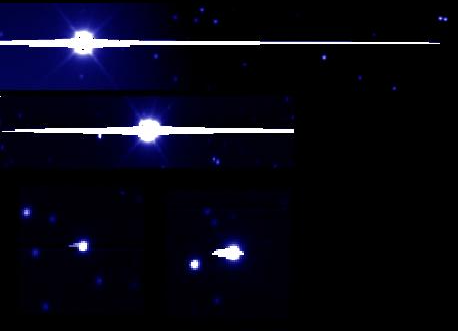
Figure 2. An image of “blooming” stars from the European Southern Observatory.
While pixel blooming is not an issue with VUV technology since the acquisition rates are typically fast enough such that the CCD wells are quickly refreshed, saturation can still occur with its deuterium light source. Figure 3 shows an example of an unsaturated deuterium reference spectrum versus a saturated reference spectrum. To eliminate this saturation, the source optic is purposely offset to put less light through the flow cell. Consequently, this offset adjustment can also be used later to extend lamp lifetime.
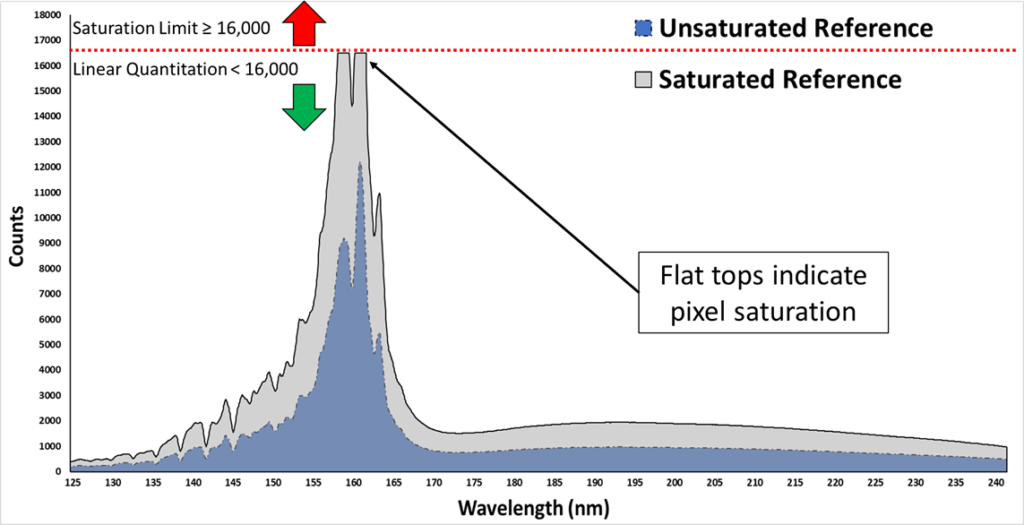
Figure 3. A saturated deuterium reference spectrum (grey) versus an unsaturated reference spectrum (blue) across the VUV range of 125-240 nm. As the CCD approaches ~16,000 counts, pixel saturation occurs. In the VUV detector, the source optic mirror is used to limit the amount of light going through the flow cell, avoiding saturation.
Depending on the concentration of a compound’s vapor cloud inside the VUV flow cell as it elutes from the GC column, another type of saturation can occur. Figure 4 illustrates an example from the GC analysis of water (yes, we can detect water!) that shows as the concentration of water gets too high, regions of the spectrum are completely absorbed. When this scenario occurs, we call the portions of the spectrum with “noisy features”, saturated. Fortunately, vapor saturation is easily (and automatically through software) controlled by reconstruction of an analyte’s spectrum from its usable parts for qualitative and quantitative purposes.
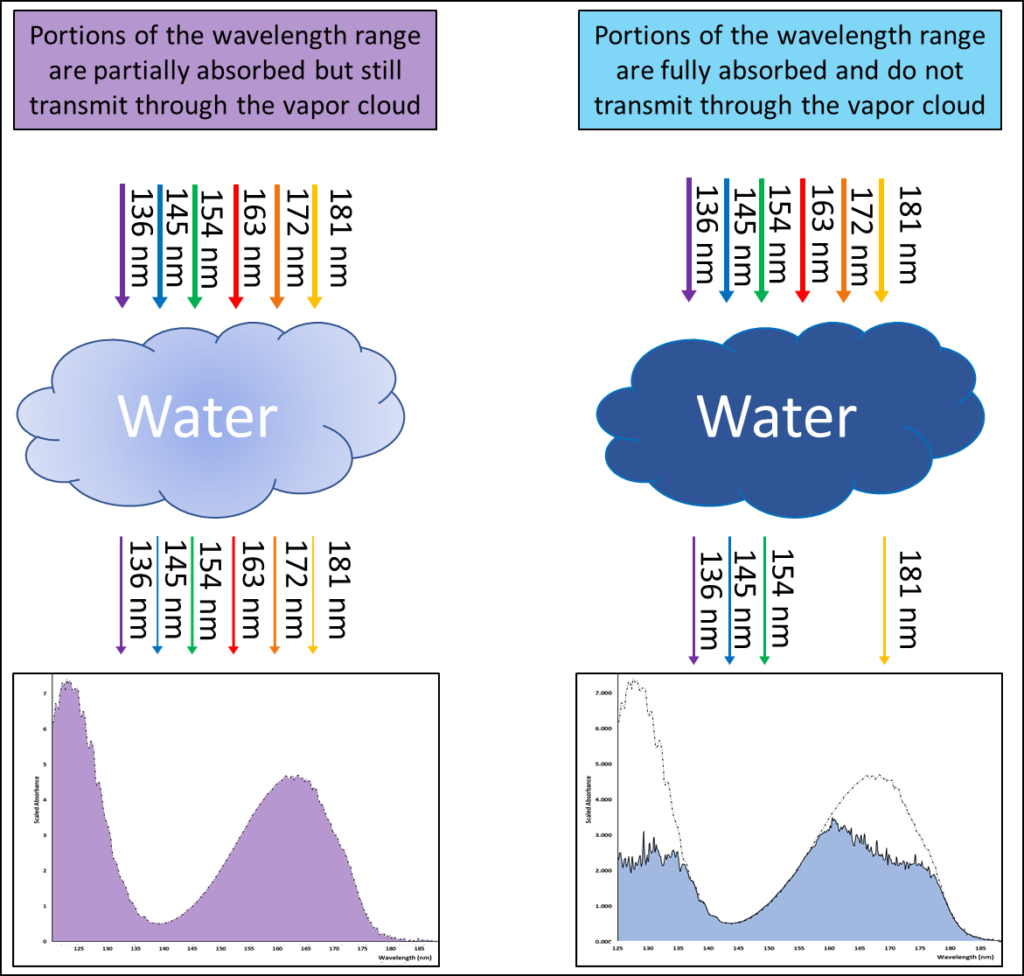
Figure 4. The arrows represent examples of electromagnetic radiation from the deuterium lamp housed in a VUV detector. The left side shows a water peak absorbing some light, but the remaining photons are still able to pass through the vapor cloud. This results in a spectrum that is not saturated. On the right side, a more concentrated water peak is completely absorbing portions of the electromagnetic spectrum, resulting in a saturated spectrum. The spectral plots below the two clouds, highlight what a non-saturated (left) and saturated spectrum (right) look like by the shaded area below the dashed curves. The non-saturated part of the spectrum is used to easily reconstruct the spectrum for accurate identification and quantification.
So as a recap, there are two scenarios for VUV detector saturation:
- Pixel saturation – when too many photons are being dumped onto a CCD pixel. This occurs if too much light is allowed through the flow cell.
- Flow cell saturation – the complete absorption of photons at any wavelength from a vapor cloud in the flow cell. In other words, no light is transmitted through the vapor cloud because the compound’s concentration is too high.
For dealing with more severe cases of compound saturation, read my previous blog post, “Dilution Is The Solution: Handling Analyte Concentration Differentials With Makeup Gas Pressure Programming For GC-VUV”.
Author

James Diekmann
James Diekmann is currently an Application Scientist for VUV Analytics. He has been with VUV Analytics for over 4 years and is recognized as an expert in GC-VUV. Currently, he focuses on headspace analysis for volatile compounds in complex matrices such as blood. Previously, he worked on hydrocarbon characterization in gasoline-range petroleum analysis using GC-VUV. He has a B.S in Physics and Astronomy from the University of Texas at Austin.


Leave a Reply