Published Derrell Sloan, Ph.D., Customer Support Manager, VUV Analytics on September 27, 2017
In my role as Customer Support Manager at VUV Analytics, I’ve observed that seemingly complex issues can often be addressed by revisiting fundamental concepts. Take for example a recent question I received from a customer wanting to understand how C4 benzene isomers could have such distinct VUV spectra despite being so similar in chemical structure. The answer gets to one of the main advantages of VUV spectroscopy when compared to mass spectrometry. With mass spectrometry it is extremely difficult, if not impossible, to distinguish between constitutional isomers. Isomers can’t be distinguished based on mass, so your only hope of telling isomers apart is if you can differentiate based on fragmentation patterns. I think many people are comfortable with GC-MS, as well as the idea that being able to use it to see differences in isomers (or very closely related compounds) can be questionable.
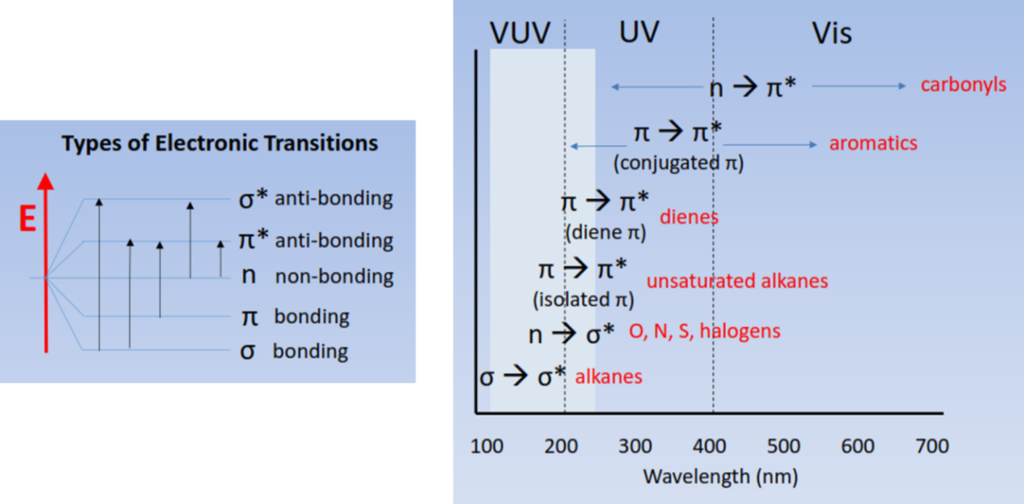
The short wavelength (125 – 240 nm) light used in the VUV absorbance measurements probes a molecule’s electronic structure. Figure 1 shows diagrams of the different types of electronic transitions and a comparison of where they are probed in the Ultraviolet spectrum.

Figure 1: Types of electronic transitions and a comparison of how they are probed in the Ultraviolet spectrum. VUV spectroscopy can fully access σ→σ* and π→π* transitions of most gas phase molecules.
One of the biggest advantages VUV spectroscopy has over mass spectrometry is that, although isomers have the exact same mass, their electronic structures are different. It’s this difference in electronic structures that allows VUV absorbance spectroscopy to distinguish between molecules with exact or similar masses. In most cases it’s easy for VUV spectroscopy to distinguish different classes of compounds because molecules within a class exhibit similar electronic transitions. For example, the δ→δ* transition seen in alkanes looks completely different from the characteristic π→π* transition observed in alkenes and aromatics.
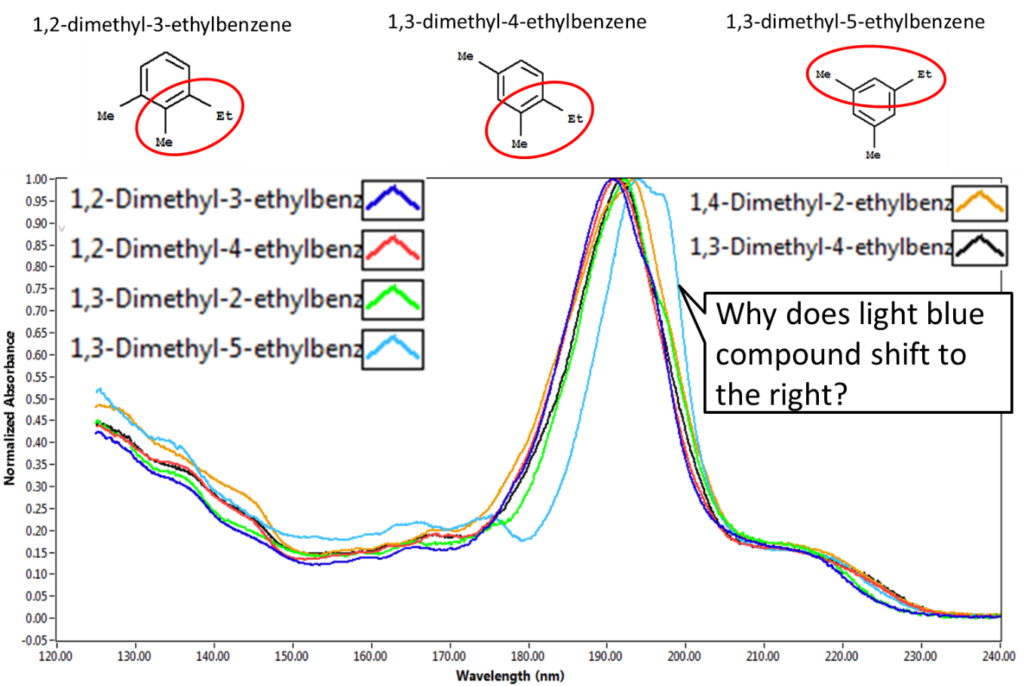
Getting back to the customer’s question about the differences in C4 benzene spectra, the double bonds in aromatic compounds show a characteristic absorbance feature around 190 nm that corresponds to a π→π* electronic transition. In Figure 2, the shift in the absorbance spectrum to a longer wavelength indicates that the energy required for this electronic transition has decreased compared to the other molecules. If you compare the molecular structure of the six different compounds listed in the figure, 1,3-dimethyl-5-ethylbenzene stands out as the only one that doesn’t have adjacent alkyl groups on the ring. I’ve provided a few examples of the molecular structures to demonstrate the point. The electronic structure of 1,3-dimethyl-5-ethylbenzene is distinctly different from the other molecules and this difference is reflected in its VUV absorbance spectrum.

Figure 2: Spectral comparison of C4 benzene isomers. Top panel inset shows how most of these compounds have adjacent alkyl groups on the ring except for 1,3-dimethyl-5-ethyly benzene which is reflected in its VUV spectrum.
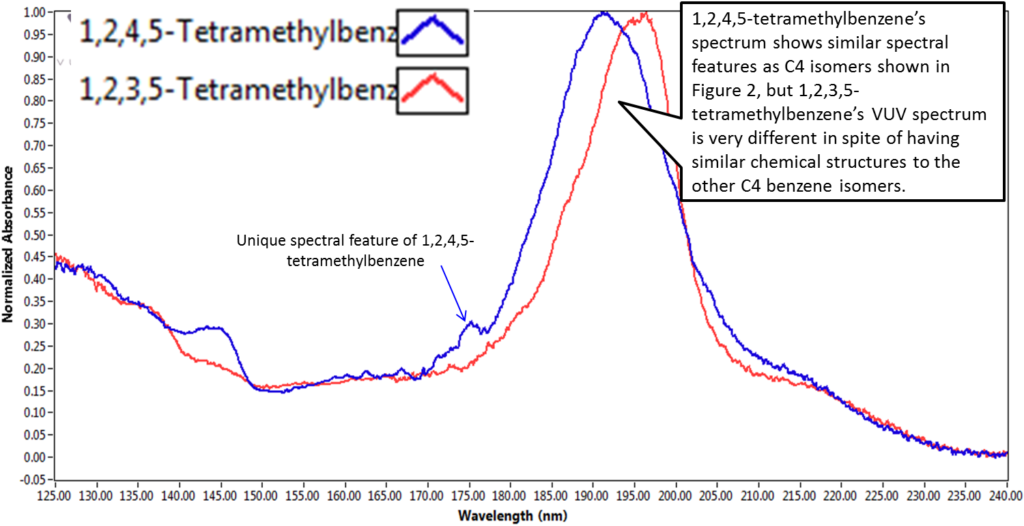
The same basic principal holds true for the spectral differences in compounds shown in Figure 3. The bump seen at ~ 175 nm for 1,2,4,5-tetramethylbenzene is too large and well defined to be noise. It also has a feature between 140 – 145 nm that is not present in the 1,2,3,5-tetramethylbenzene. These spectral features are evidence that the electronic structures of the two compounds have significant differences, and that the VUV absorbance measurement is sensitive to these differences. It may sound a bit simplistic to say that absorbance spectra are different because the electronic structures of compounds are different, but in reality, that’s the fundamental concept behind VUV detection capabilities.

Figure 3: Spectral comparison of 1,2,3,5-tetramethylbenzene and 1,2,4,5-tetramethylbenzene. The differences in chemical structure of these compounds are reflected in their spectral features.


Leave a Reply