Published Ryan Schonert on June 10, 2019
Using VUV’s Spectral Filters to Analyze Lipstick
By: Ryan Schonert
Using a VGA-101 in conjunction with a high temperature Rxi-1HT GC column, we’re able to bring the GC oven program to 400°C and the transfer line / flow cell to 425°C, allowing us to analyze samples with higher C# compounds. Recently, I’ve been using this high temperature setup to tackle a new project; applying GC-VUV to analyze lipstick samples, which are waxy and need high GC temperatures to elute low volatility compounds successfully. After extracting some lipsticks using hexane and methylene chloride, I ran some samples and looked at the data. Here’s where I made a rookie mistake; I didn’t check the spectral filters.
I ran the samples on a VGA-101 with a wavelength range of 125-430 nm. When I first looked at the data over the full wavelength range, here’s what I saw (Figure 1):
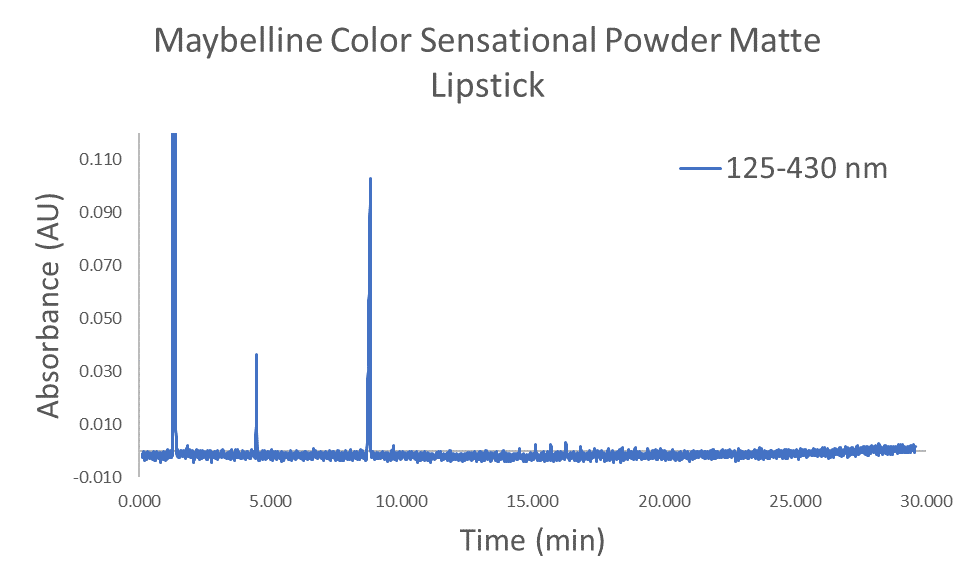
Figure 1. Lipstick sample extract analyzed on the VGA-101, 125-430 nm.
There are a few large peaks and some smaller peaks, but nothing too exciting. By this point, I was already brainstorming; how could I improve this extraction? Surely there are more compounds I could extract than the few I see here. However, Jack pointed out that changing the spectral filter to 125-160 nm would probably show a lot more detail. As usual, he was right. There was a lot more detail hidden within the chromatogram (Figure 2).
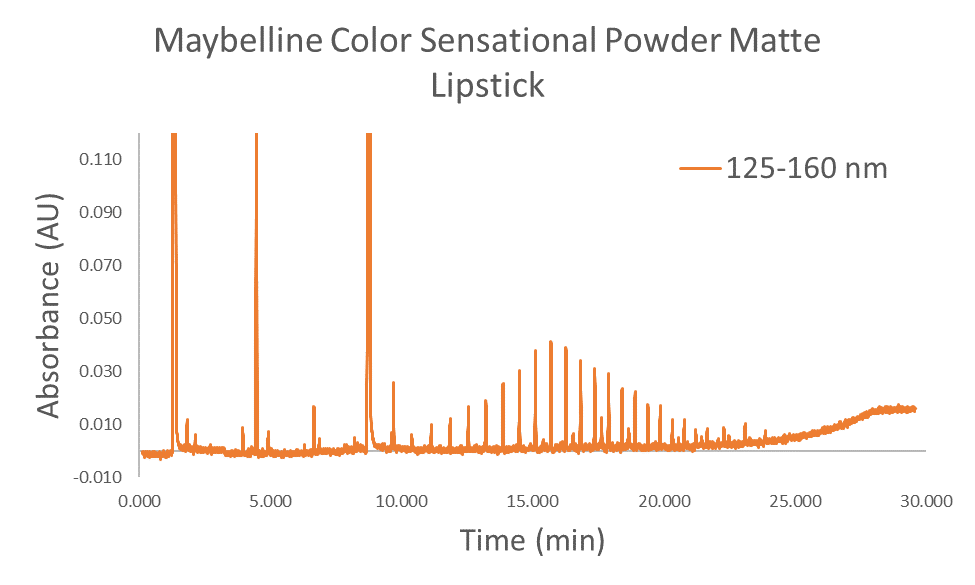
Figure 2. Lipstick sample extract analyzed on the VGA-101, 125-160 nm.
Spectral filters are very powerful tools. In a previous blog post, my colleague Alex describes how spectral filters can simplify otherwise complex chromatograms. However, as shown here, the reverse is also true! As you can see, applying the 125-160 nm spectral filter reveals a lot of data not visible in the default filter, which averages the spectra over the full 125-430 nm range. In this case, almost all the compounds absorbed exclusively from 125-200 nm, meaning that the spectral range of 200-430 nm was only bringing down the average response displayed over the full 125-430 nm range.
Even without looking at the individual spectrum of each peak, I can already tell you that this lipstick extract consists almost entirely of saturated hydrocarbons (paraffins, isoparaffins, naphthenes). Unlike olefins and aromatics, which have pi bonds that absorb strongly in the 170-200 nm range, saturates absorb strongly at this lower wavelength range. One interesting feature of this chromatogram is the series of peaks from 10 – 22 minutes. These appear to be a series of paraffins, and so to check, I also ran a linear alkane standard with even-numbered paraffins from C8-C40 (Figure 3). These appear to line up well, which makes sense, as one of the ingredients in this lipstick is paraffin wax.
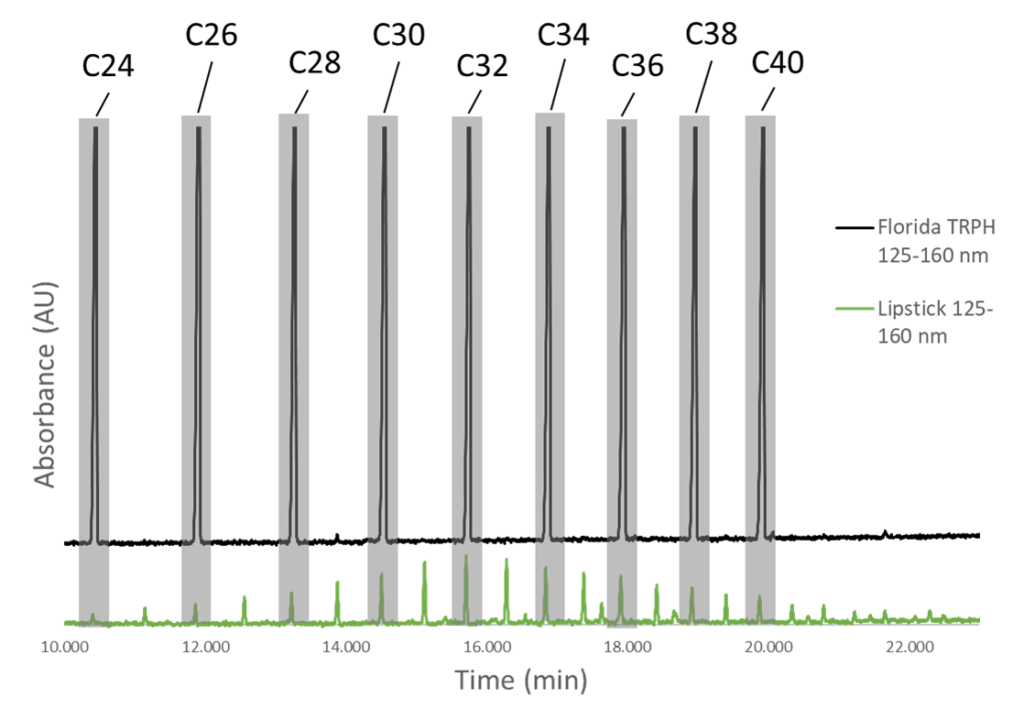
Figure 3. Lipstick sample extract and Florida TRPH linear alkane standard, 125-160 nm.
If I hadn’t checked my spectral filters, I could have missed a lot of valuable information. VUV has a lot of powerful tools, so make sure you don’t forget to take advantage of them!





Leave a Reply