Published Ryan Schonert on September 14, 2020
Once we calibrate each VGA detector to the proper wavelength settings, the remaining test samples can be analyzed. One of these test samples contains several ethers, which we can use to examine the instrument for signs of system reactivity.
What is System Reactivity?
The VGA-100’s transfer line and flow cell can be heated up to 300°C (430°C for the VGA-101). At these temperatures, sample molecules can react with the steel body of the transfer line/flow cell, and that could adversely affect sample analysis. For example, the gasoline additive methyl tert-butyl ether (MTBE) can undergo the degradation reaction shown in Figure 1.

Figure 1. Degradation of MTBE to isobutylene and methanol. Because MTBE is consumed in the reaction, any analysis measuring MTBE content would give low results.
Although system reactivity is a concern for all industries, gasoline analysis is particularly relevant here, as MTBE is commonly added as a gasoline additive, especially in Europe. Additives like MTBE must be regulated thoroughly, but gasoline analyzed in a reactive system will give low MTBE readings as some of it converts to isobutylene and methanol.
To maintain the integrity of the sample, the flow cell and transfer line are given an inert coating. The coated flow path protects sample molecules from the heated steel, increasing the accuracy of the analysis. However, it’s possible that the coating may not be applied perfectly and there may be small patches of exposed metal, and this could still affect sample analysis, as shown in Figure 2.


Figure 2. MTBE molecules traveling through the heated flow path of the transfer line/flow cell (top). MTBE molecule reacting with an uncoated portion of the flow path (middle). Altered sample after MTBE degradation (bottom). Although the coating protects most of the sample, some MTBE content may be lost to degradation caused by uncoated portions of the flow path. This can lead to inaccurate results.
Testing for System Reactivity
We use a mixture of ethers, including MTBE, to inspect each system for reactivity. Thankfully, we know the degradation products for each ether, so we can specifically look for them during instrument qualification testing. In the case of MTBE, we look for isobutylene and methanol, both of which have spectra distinguishable from MTBE, as shown in Figure 3.
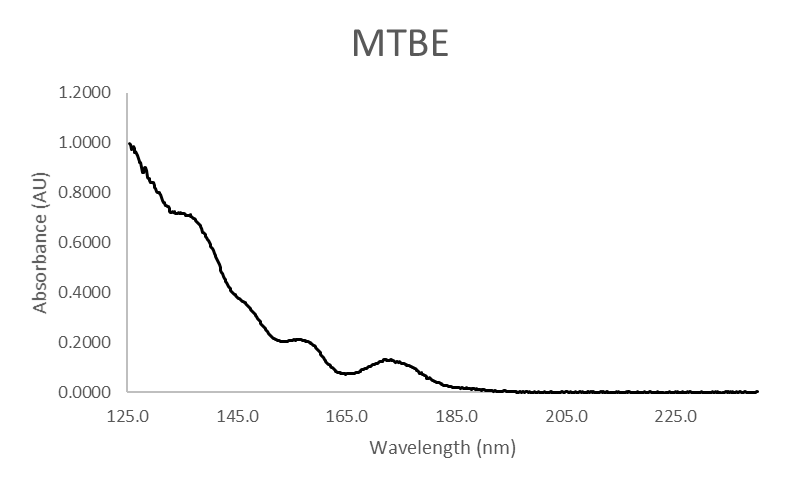
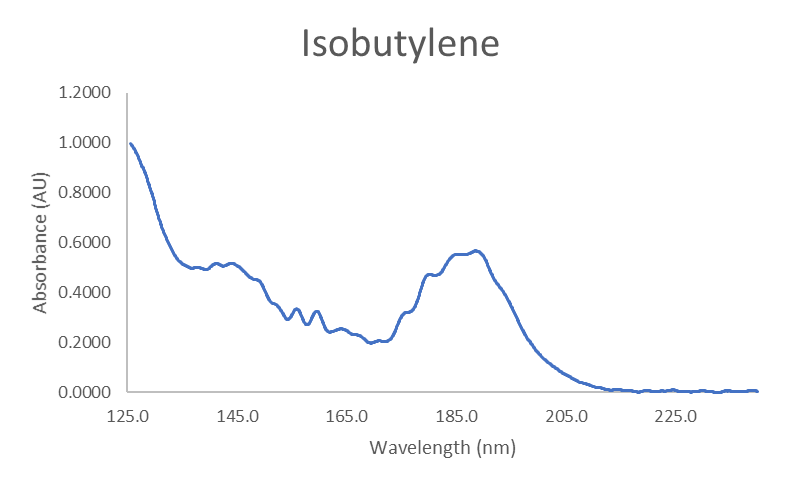
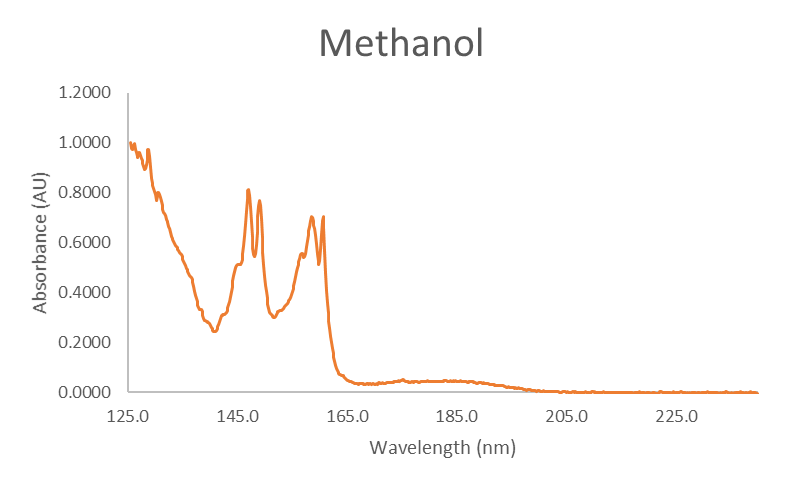
Figure 3. Absorbance spectra for MTBE, isobutylene, and methanol.
Because this reaction occurs in the detector rather than the GC column, the compounds don’t have time to separate and form distinct peaks. We can use spectral deconvolution to distinguish and quantitate the three different compounds present under the MTBE peak, as shown in Figure 4.
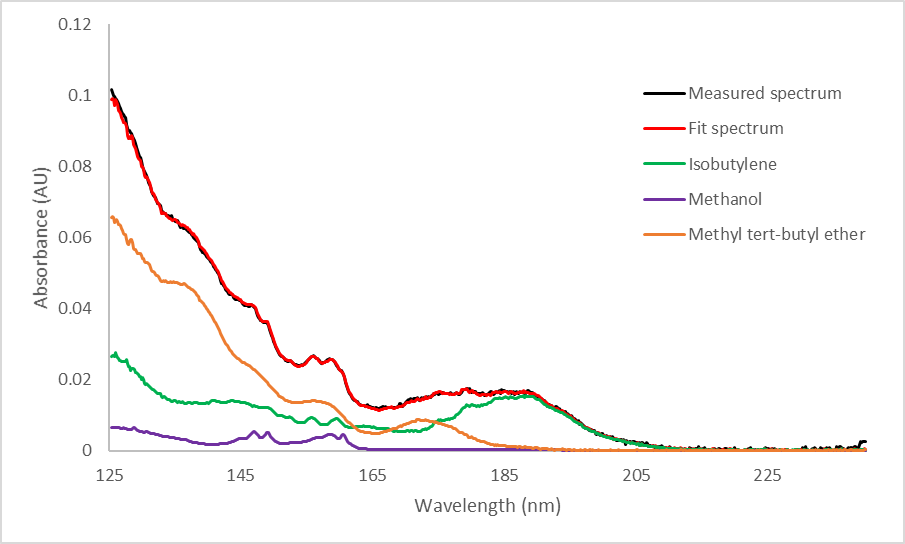
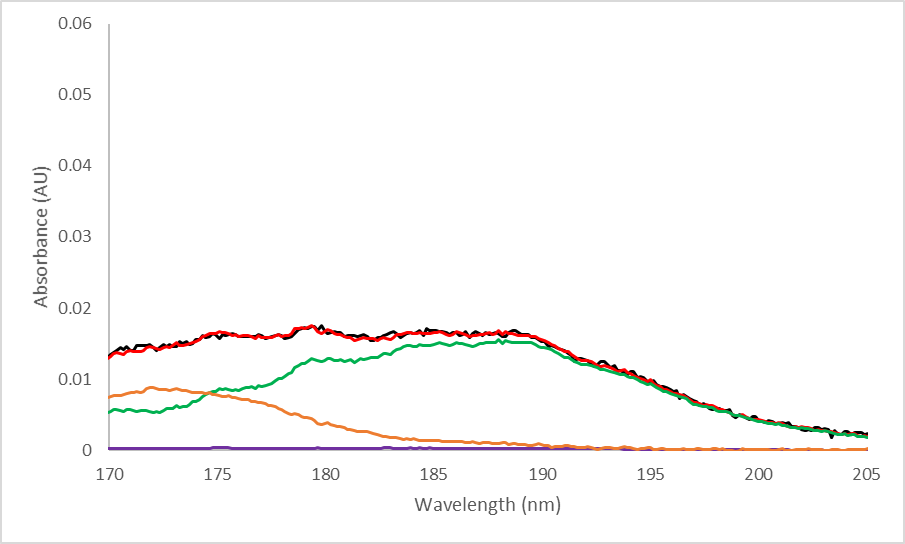
Figure 4. Measured and deconvolved spectra of MTBE in a reactive system (top). Zoomed portion of the deconvolved spectrum (bottom). Reactive systems will form some isobutylene and methanol, which will elute with the remaining intact MTBE molecules. The spectra for these 3 compounds can be distinguished via spectral deconvolution. The most visible difference between a regular MTBE spectrum and a spectrum containing degradation products is around 170-205 nm; in this region, additional absorption due to isobutylene is clearly visible since MTBE absorbs very little here.
The mixture of ethers we use is particularly prone to this type of degradation, so we’re able to keep a close eye out for any signs of potential system reactivity. If we do find evidence of reactivity, the transfer line and flow cell can be re-coated to ensure the system is working at its best.
Stay tuned for upcoming posts on how we inspect and qualify our systems!




Leave a Reply