Published Ryan Schonert on August 19, 2019
Using Library Spectra to Judge the Quality of your Matches
VUVision™ and VUV Analyze™ Software, the two main software packages we’ve developed to pair with our VUV spectrometers, can be your best friends once you learn how to use them. This is especially true for VUV Analyze, which I use almost exclusively for the gasoline-range samples I analyze on a daily basis. As you’ve likely read in other blog posts and various presentations we’ve given, VUV Analyze uses time interval deconvolution™ (TID) to identify compounds using both spectral information and Retention Index (RI) values. Even complex samples like gasoline can be automatically analyzed very quickly.
VUV Analyze has three modes: Production, Setup, and R&D. Although Production Mode and Setup Mode are useful for quickly analyzing gasoline samples, I find myself using R&D mode most often. It can be used to perform ASTM D8071 PIONA (Paraffins, Isoparaffins, Olefins, Naphthenes and Aromatics) analysis, but it also has several tools designed to augment R&D-type work. We took a quick look at some of these tools in a recent webinar (you can watch it here if you’re curious!), but I’d like to take a closer look at some of these R&D tools here. Let’s start with a simple one: using the spectra to judge the quality of your matches.
Take a look at Figure 1. In the Spectra tab, there are a couple of things to note. First, in the spectral window, we can see two spectra: the green absorbance spectrum that is recorded from the run file and the blue fit spectrum pulled from the VUV spectral library. As you can see in the spectral window, our measured absorbance spectrum is matching up well with the fit spectrum, indicating that the software’s identification is good. The quality of our match can be confirmed by looking at the residual window, right above the spectral window. We see a nice flat line, indicating that the software’s identification is consistently good throughout the whole 125-240 nm spectrum. So, what compound are we looking at? If we look at the Fit info tab, we find that this peak is actually a coelution of xylenes, as shown in Figure 2.
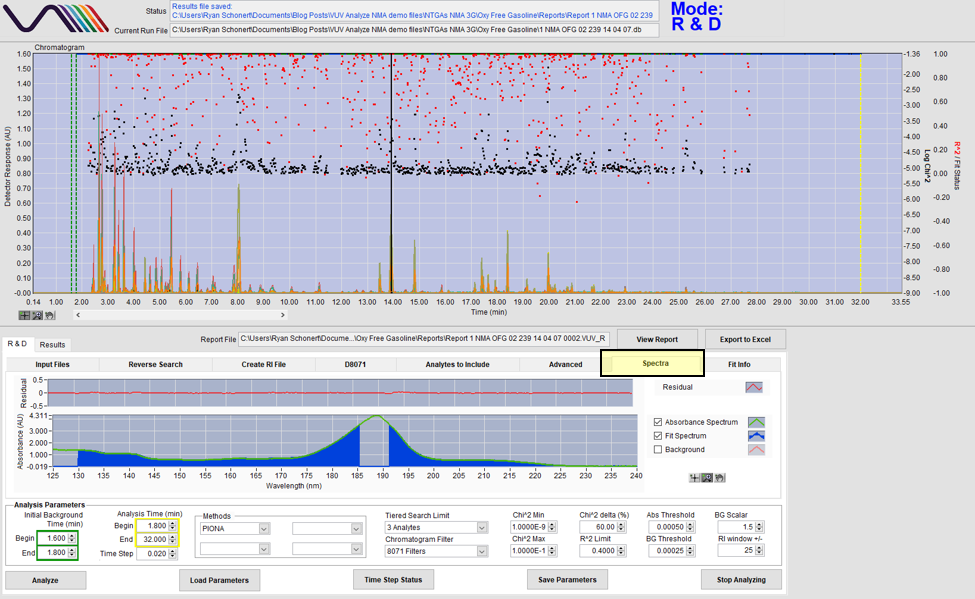
Figure 1. A coelution of m-xylene and p-xylene identified by VUV Analyze. The measured absorbance spectrum (green) and fit spectrum (blue) match well, and the residual measurements (red) are low, indicating a good match. Note that the saturated part of the spectrum around 185-190 nm is blank, as VUV Analyze doesn’t use saturated spectra for quantification, but the rest of the spectrum can still be used.

Figure 2. Compounds identified in the peak, listed under Fit info. Despite the peak being a coelution of closely related isomers, VUV Analyze can still distinguish and individually quantify each compound.
Now take a look at Figure 3. Unlike the xylenes, the match for this peak isn’t nearly as good; the measured absorbance and fit spectra aren’t matching up well, and the residual chart is a mess. So, we’ve found an anomaly in our gasoline sample: what now? Be on the lookout for Part 2 to find out!
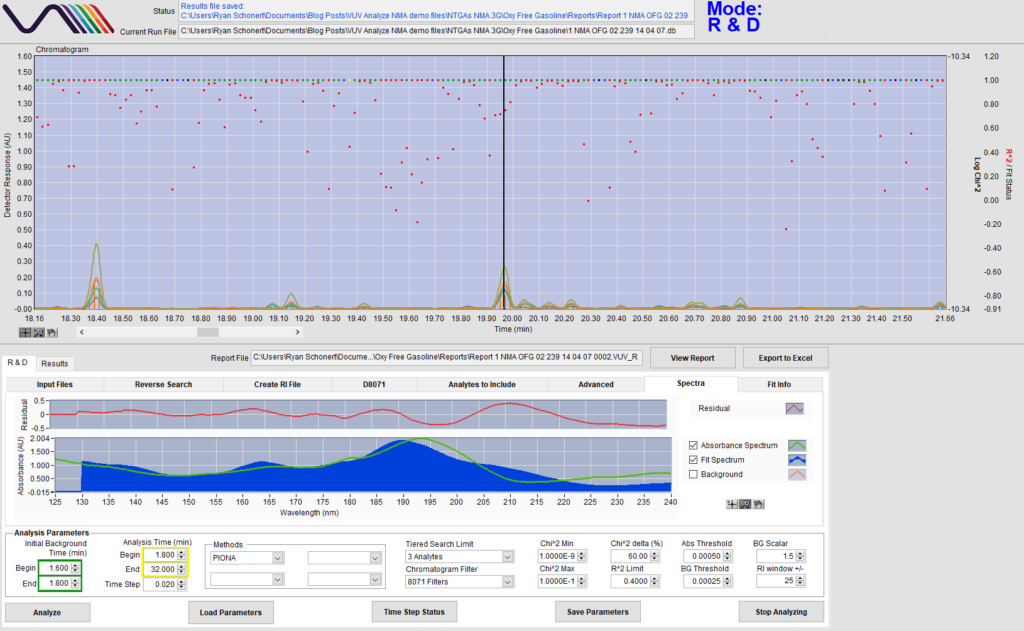
Figure 3. Although VUV Analyze attempts to match the compound, it’s clear that this compound isn’t present in the VUV PIONA spectral library, as the measured/fit spectra are not matching up, and the residual chart spikes.




Leave a Reply