Published Ryan Schonert on September 3, 2019
Using VUVision Software to identify mis-identified peaks
In Part 1, we looked at a gasoline sample with a mis-identified peak. We could see that the measured absorbance spectrum and the fit spectrum weren’t matching up well, and the residuals indicated a bad fit. So, what’s the next step?
The first thing we can do is try and identify the compound using VUVision™ Software. The full VUV reference library contains thousands of spectra, while the VUV PIONA spectral library only contains compounds that are pertinent to gasoline. If we load the file into VUVision and take a look at the peak, we see in Figure 1 that the compound is N-methylaniline (NMA), a compound that’s been reported as a harmful gasoline additive. Although NMA can boost a fuel’s octane rating, it has been demonstrated to cause high gum formation, lower gasoline stability, and lead to oil leaks by swelling seal rings.
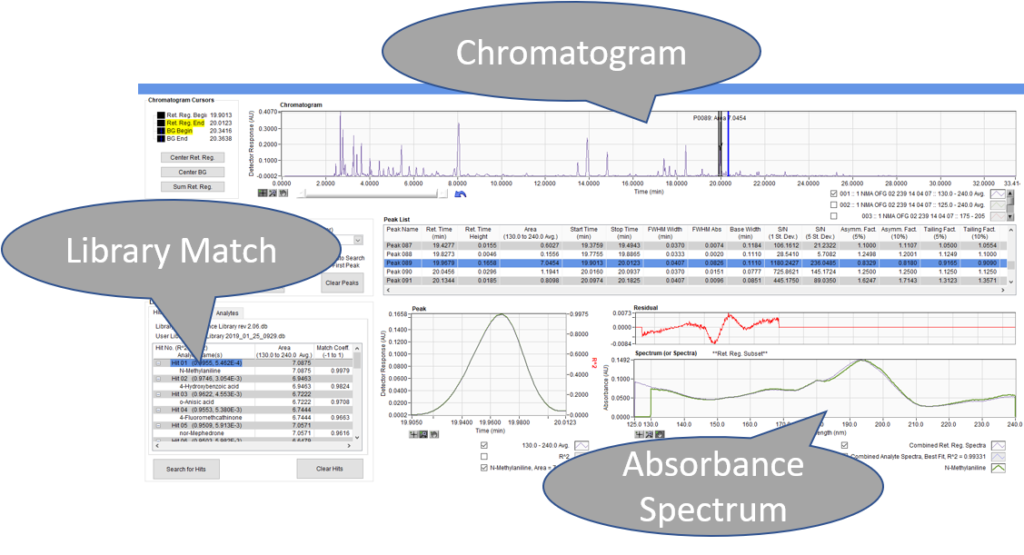
Figure 1. Identification of the unknown peak as N-methylaniline (NMA) using VUVision. This compound was identified using the full VUV spectral library, but the NMA entry can be added to the PIONA library using VUVision’s Library Editor tool.
Now that we’ve identified the compound, we can use VUVision’s Library Editor tool to copy N-methylaniline over to the PIONA library. Once the sample is re-run, we can see that the peak is properly identified, as shown in Figure 2.
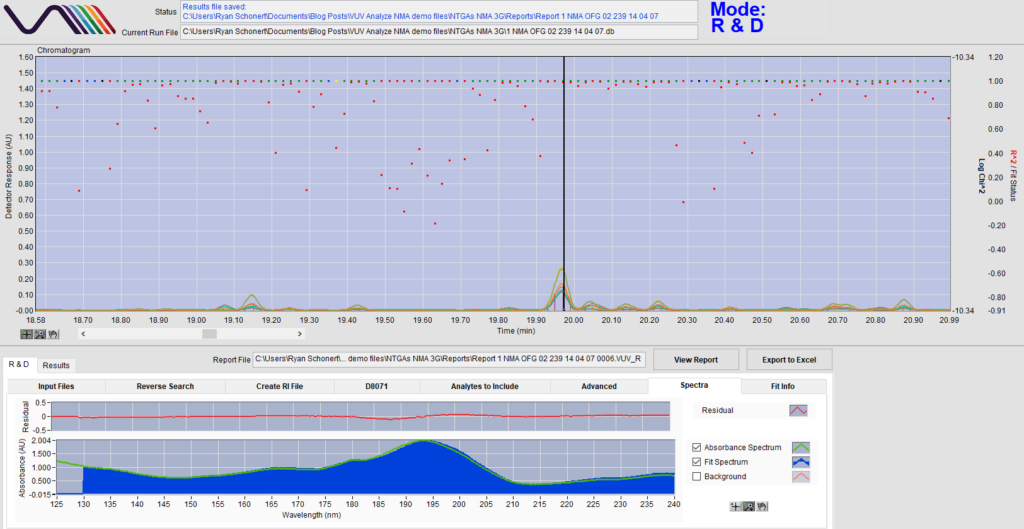
Figure 2. After adding NMA to the library and reanalyzing the data file, the unknown NMA peak dramatically improves. Unlike before, the measured absorbance spectrum (green) and the fit spectrum (blue) visually match up well, and the residual chart is flat, similar to the xylene residual that we saw in Part 1.
Now, VUV Analyze can identify and quantify NMA. We can tell VUV Analyze to report NMA in each sample by adjusting the report method, shown below in Figure 3. In Part 3, we’ll take the principle of customizing your analysis with VUV Analyze and apply it to QA/QC standard checks.
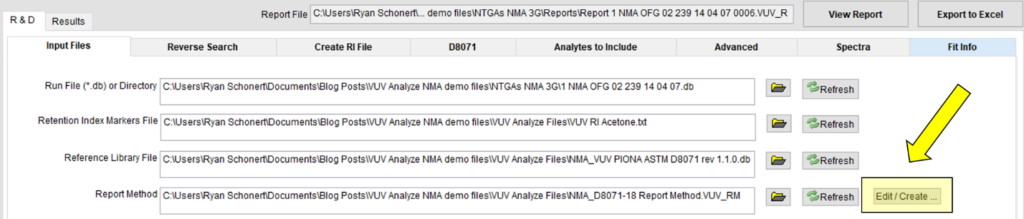
Figure 3A
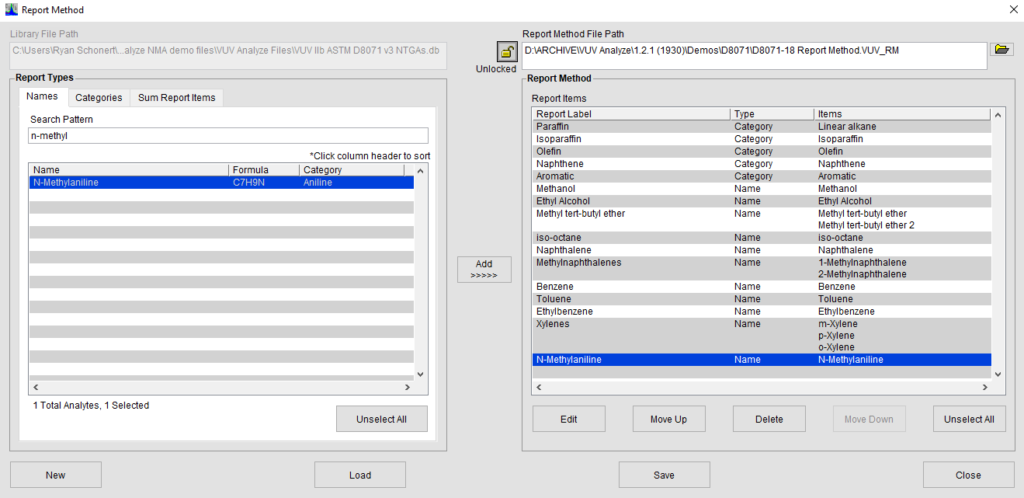
Figure 3B
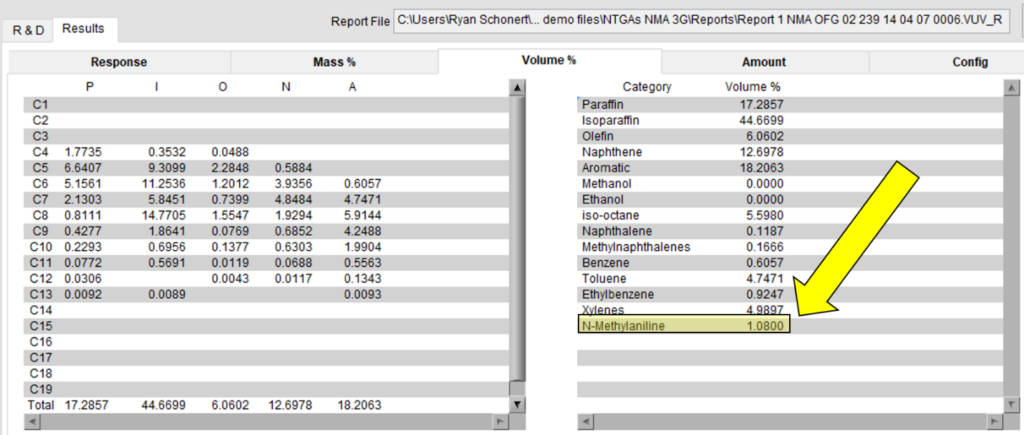
Figure 3c. a) Using the Edit/Create Report Method button, NMA can be added to the report file generated after each sample analysis. b) NMA is added to the analysis parameters along with the items reported by default with ASTM D8071. Note that you can add both individual compounds, groups of individual compounds (such as xylenes), or entire categories (paraffins, isoparaffins, etc. – or any custom categories you set up in your own library!). c) Reported NMA results are shown along with the PIONA results needed for ASTM D8071 analysis.
Author

Ryan Schonert
Ryan Schonert is currently an Application Scientist for VUV Analytics. Prior to joining VUV Analytics, Ryan performed research on the extraction and characterization of additives in smokeless powders using GC-MS and SEM-EDS. He earned a B.S. in Chemistry from Illinois Wesleyan University and an M.P.S. in Forensic Science from the Pennsylvania State University.
One response to “Getting to Know VUV Analyze™, Part 2”
Leave a Reply
Related Reading
Standardizing Your Analysis: ASTM D8267 Standards
by Chris Cook
In this blog, we discuss the importance of all standards used in our ASTM D8267…
Read More >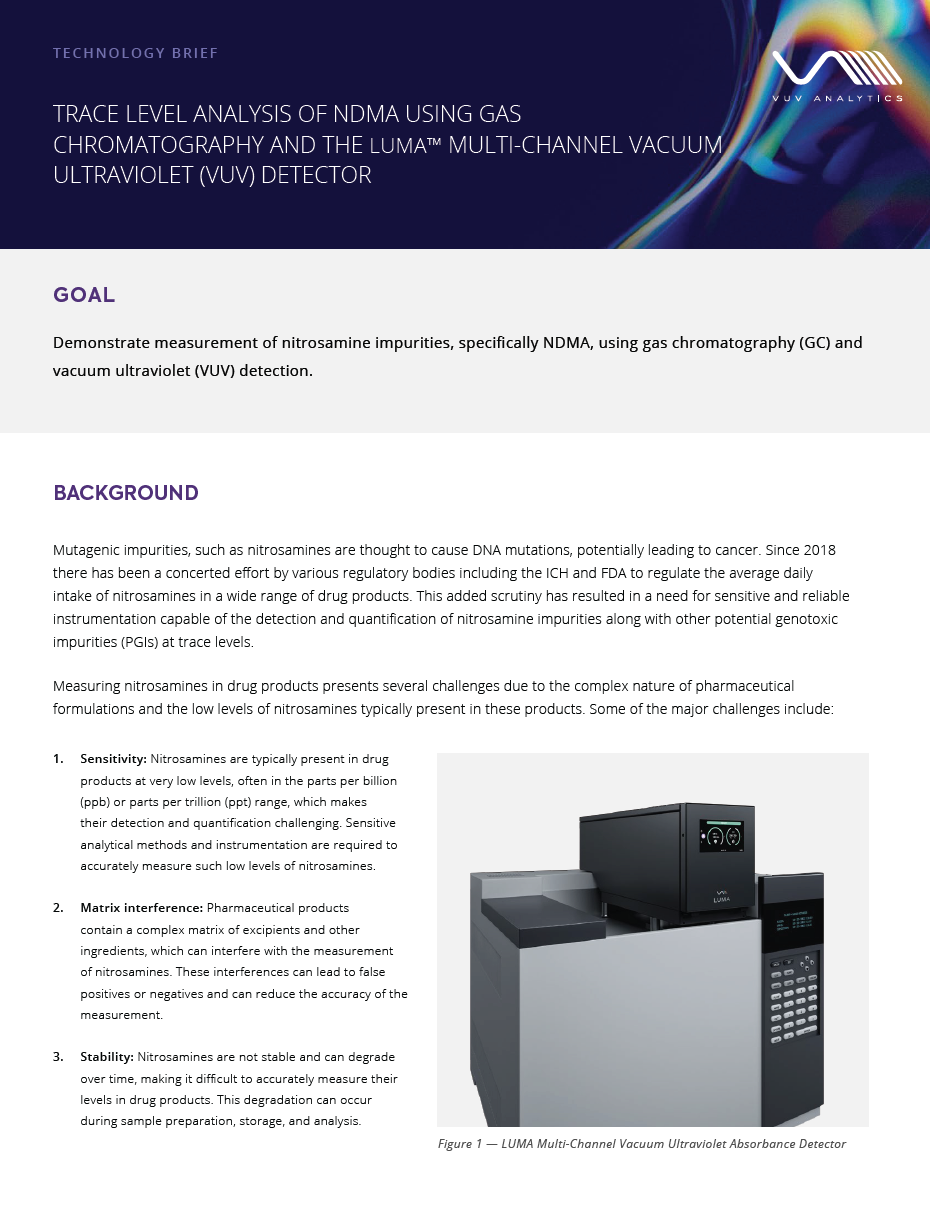
TRACE LEVEL ANALYSIS OF NDMA USING GAS CHROMATOGRAPHY AND THE LUMA™ MULTI-CHANNEL VACUUM ULTRAVIOLET (VUV) DETECTOR
Mutagenic impurities, such as nitrosamines are thought to cause DNA mutations, potentially leading to cancer.…
Read More >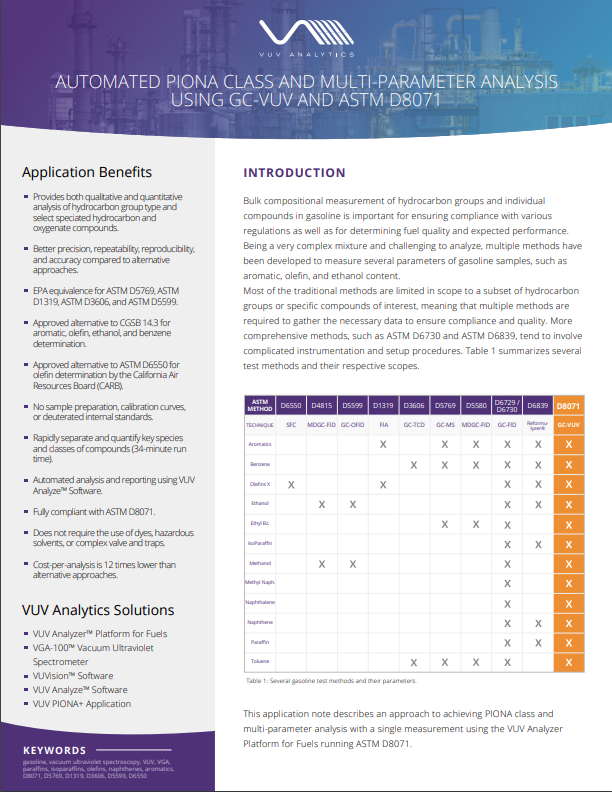
Automated PIONA Class & Multi Parameter Analysis using GC-VUV and ASTM D8071
This is the official application note for the Automated PIONA class and multi-parameter analysis using…
Read More >


How do you distinguish whether it is pure n – methyl aniline or its next nearest stable isomer or a mixture of both.