Published Ryan Schonert on September 23, 2019
Using VUV Analyze for Quality Assurance / Quality Control
Quality assurance/quality control (QA/QC) is nobody’s favorite thing to do, but it’s necessary to make sure a lab process is working as intended. Testing your instrument’s performance is an important aspect of QA/QC, and we can do that using VUV Analyze Software. Under ASTM D8071, there are three standards we use on a regular basis: VUV-RT, VUV-1, and VUV-CS. VUV-RT is a retention time standard used to create the retention index (RI) file, VUV-1 is a standard mixture of 28 compounds found in gasoline, and VUV-CS is a standard gasoline sample. The RI file can be created by loading the VUV-RT run file into the Create RI File box, and VUV-1/VUV-CS can each be checked using the Calculate Response and Analyze QC boxes, respectively, as shown in Figure 1.
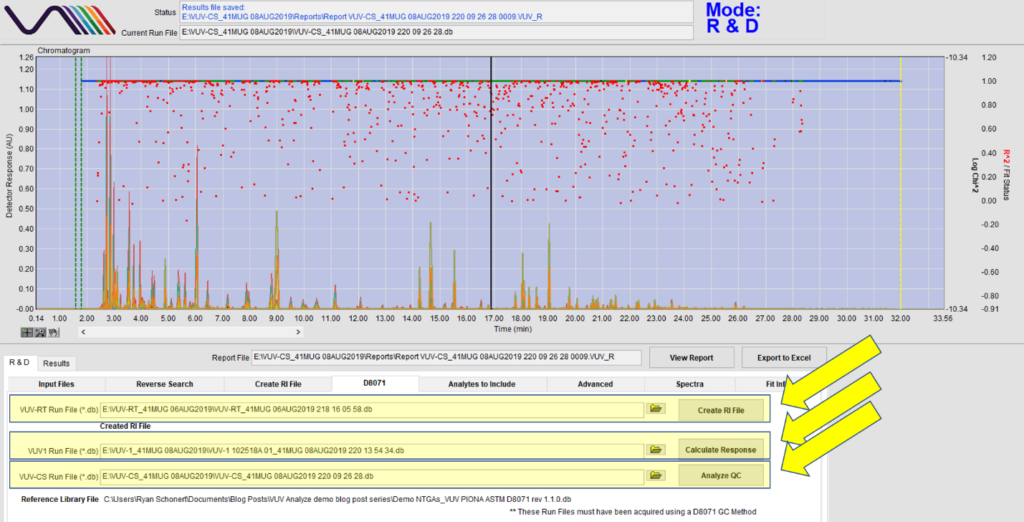
Figure 1. QA/QC checks are built into VUV Analyze under the D8071 tab. VUV Analyze can create a retention index (RI) file from the VUV-RT run, and then VUV-1 and VUV-CS can be checked using the VUV-1 Run File/Calculate Response and VUV-CS Run File/Analyze QC buttons, respectively.
VUV-1 is used to check three aspects of instrument performance:
- Benzene response – the response of benzene in a sample can be used to set the instrument at the proper makeup gas pressure. A proper makeup gas pressure is important to make sure eluting compounds have the proper residence time in the detector flow cell.
- Baseline stability – VUV Analyze checks the baseline at the beginning and the end of the run and will fail the test if the baseline drifts beyond a certain amount. Fluctuating baselines are often caused by leaks somewhere along the GC-VUV flow path.
- PIONA values – the PIONA values measured are compared to the standard values built into VUV Analyze.
Sample VUV-1 results can be seen in Figure 2.
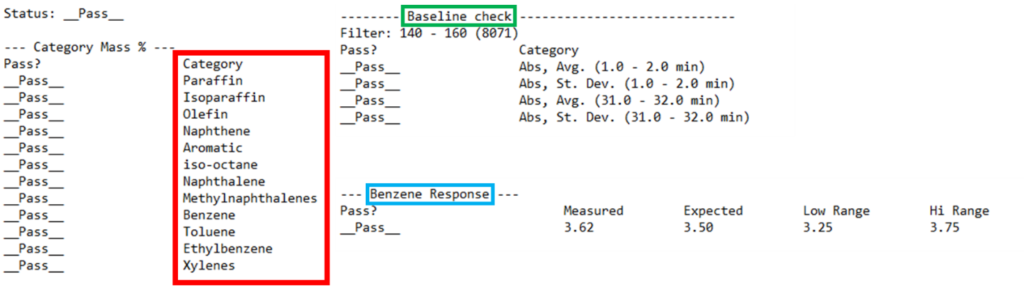
Figure 2. Selected results from an analysis of VUV-1. The VUV-1 check analyzes the benzene response, baseline drift, and PIONA content being measured by the system. Note that if the benzene response test fails, VUV Analyze will suggest a new makeup gas pressure setting.
Like VUV-1, VUV-CS is used to check the PIONA values being measured. Example results can be seen below in Figure 3.
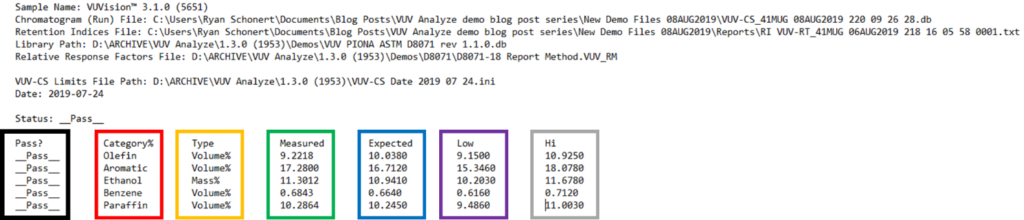
Figure 3. Sample analysis from the Analyze QC check built into VUV Analyze. The results file shows the category checked, the type of value checked (mass% or vol%), the measured value, the expected value, and the low/high limit values.
However, what if you aren’t running gasoline samples, or what if your company has their own QA/QC samples they’d like to run? No problem. The limit values used in the QA/QC buttons can be altered to tailor your QA/QC samples.
Note: These settings are meant to be adjusted ONLY by experienced VUV Analyze users. Before continuing, please consider the following points:
- This is not a full tutorial; before adjusting these settings, you should contact VUV Analytics first to get the proper assistance.
- Currently, these settings are adjusted by altering the .ini files. Keep a copy of the original .ini files before making any changes.
For this example, I am using a gasoline sample spiked with 2,5-dimethylfuran, an environmentally friendly additive used as an octane booster. Suppose I want to check the gasoline sample’s content of paraffins, aromatics, benzene, and 2,5-dimethylfuran, which isn’t covered by the default Analyze QC check. Figure 4 is a snapshot of the .ini file I set up, and Figure 5 shows the results of a sample I prepared.
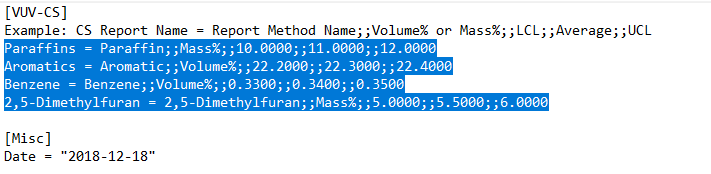
Figure 4. Custom .ini file set to analyze 2,5-dimethylfuran, an eco-friendly gasoline additive I spiked in at approximately 5% by mass, as well as paraffins, aromatics, and benzene. Each line in the report has custom values that can be tailored to each lab’s individual needs.
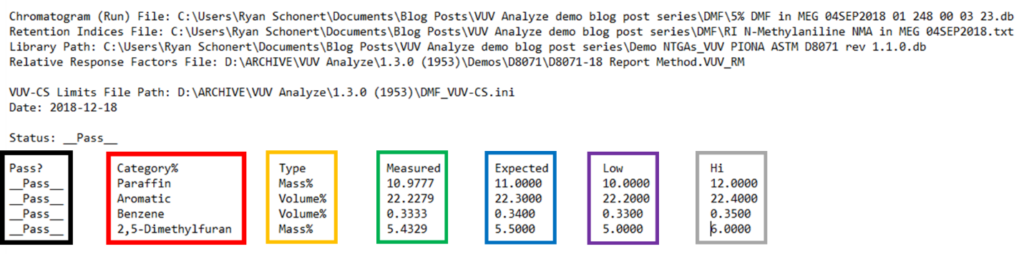
Figure 5. QA/QC results of the spiked gasoline sample I prepared using a custom QA/QC check with the Analyze QC functionality. Like with the default VUV-CS check, the custom check provides a simple report that lists each item, the value checked, the measured value, and the low/high/expected values built into the custom .ini file.
If these custom QA/QC checks are of interest to you, please reach out to us and let us know how we can help! Since this part of VUV Analyze is still in development, we’d love to get some feedback from our customers. If you have feedback please email it to info@vuvanalytics or leave your comment below.
Did you miss the first two parts of the VUV Analyze Series? Read Part 1 or Part 2 here.
Otherwise, stick around for the final part, Part 4 and we’ll take a look the Analytes to Include feature.
Author

Ryan Schonert
Ryan Schonert is currently an Application Scientist for VUV Analytics. Prior to joining VUV Analytics, Ryan performed research on the extraction and characterization of additives in smokeless powders using GC-MS and SEM-EDS. He earned a B.S. in Chemistry from Illinois Wesleyan University and an M.P.S. in Forensic Science from the Pennsylvania State University.
Related Reading
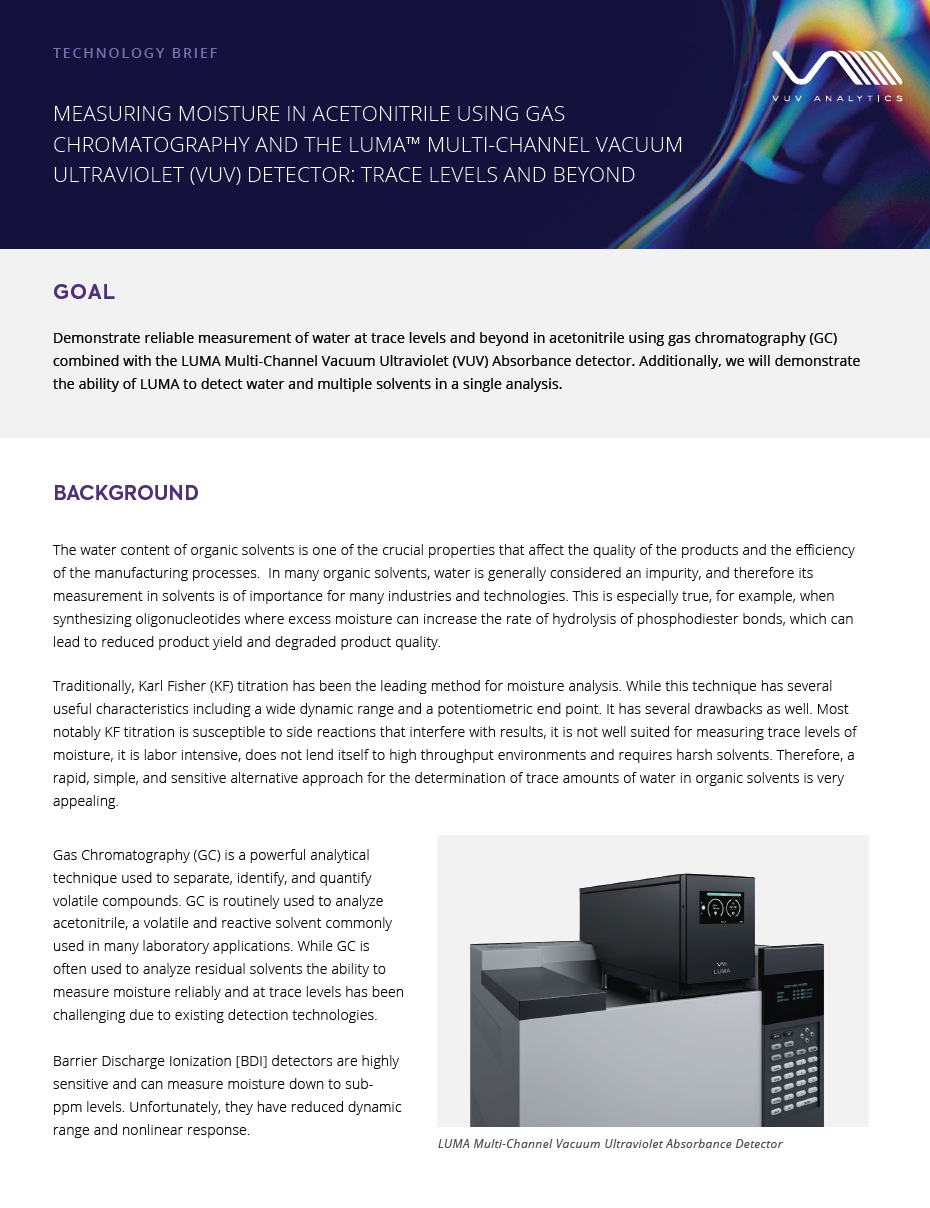
Measuring Moisture in Acetonitrile Using Gas Chromatography and the LUMA Vacuum Ultraviolet (VUV) Detector: Trace Levels and Beyond
The water content of organic solvents is one of the crucial properties that affect the…
Read More >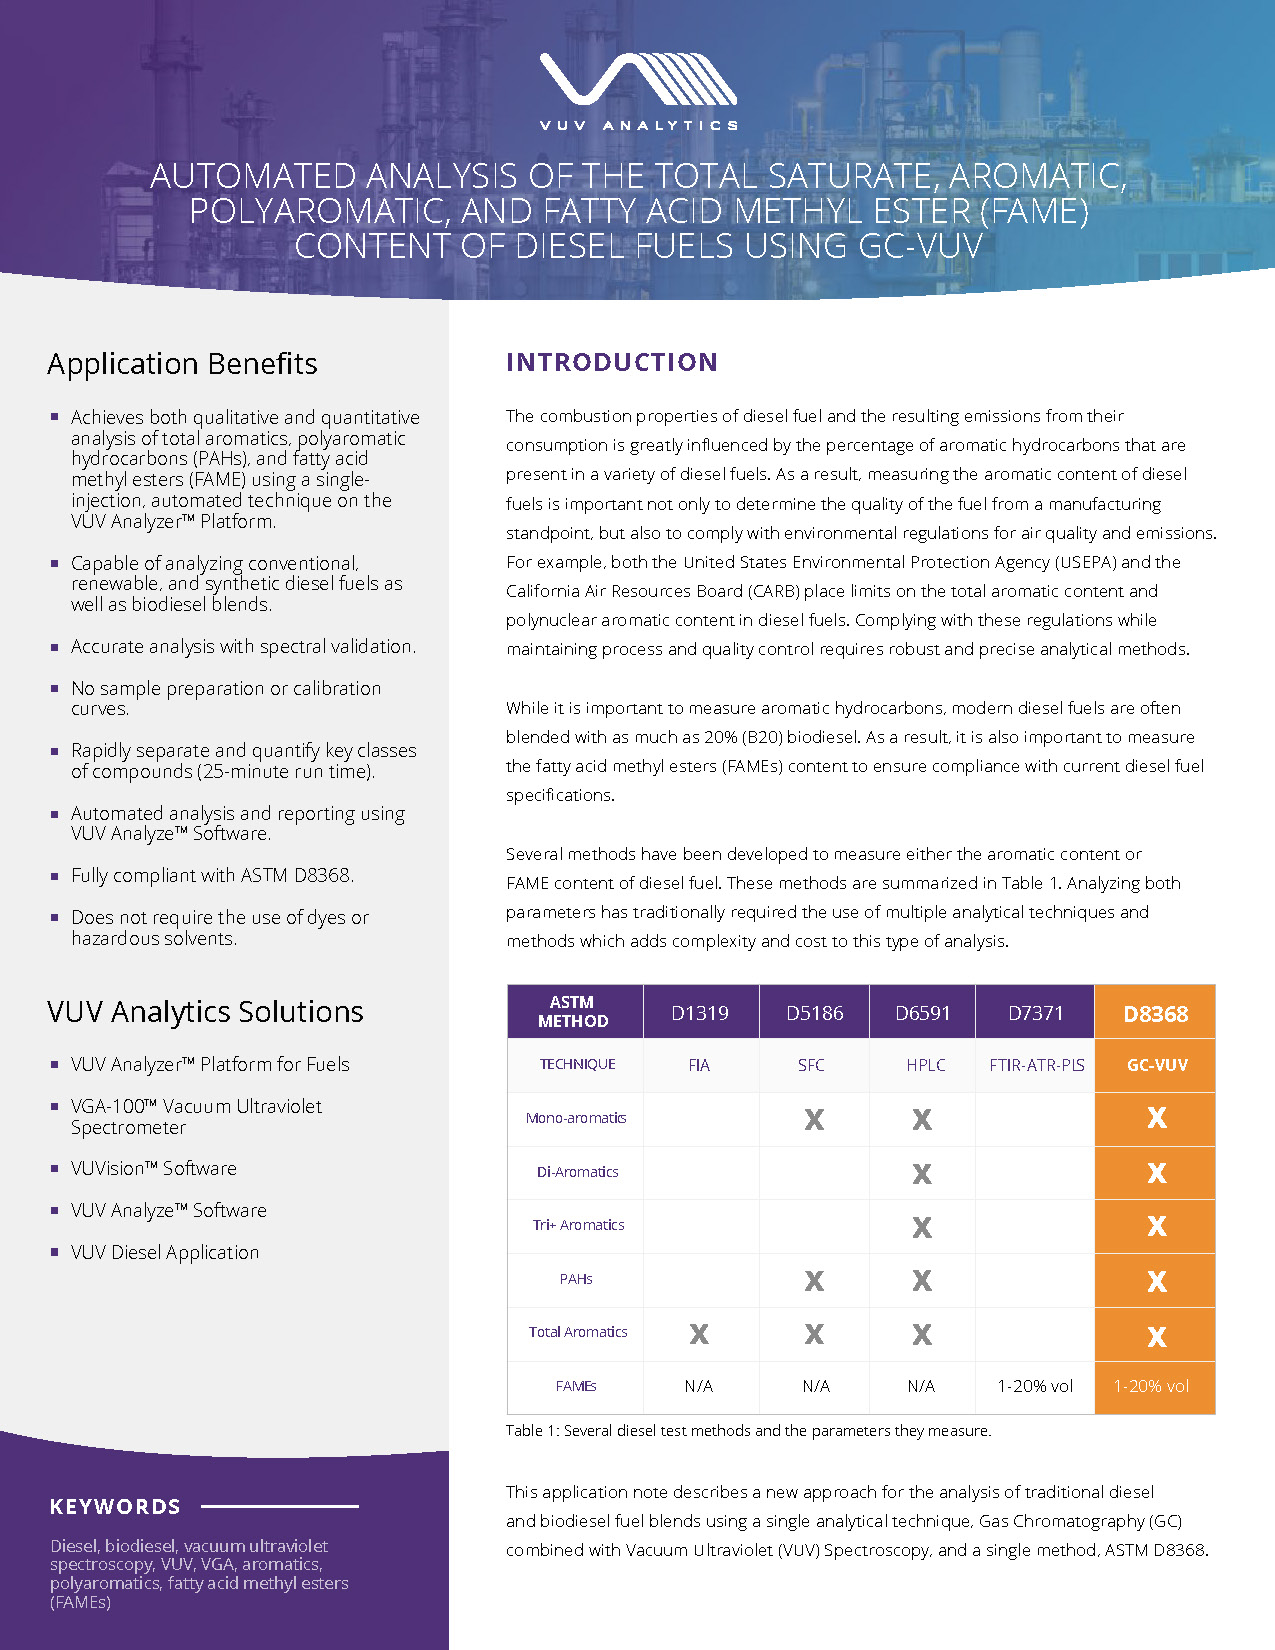
Automated Analysis of the Total Saturate, Aromatic, Polyaromatic, and Fatty Acid Methyl Ester (FAME) Content of Diesel Fuels Using GC-VUV
This is the official application note for the VUV Diesel Analyze Application using GC-VUV and…
Read More >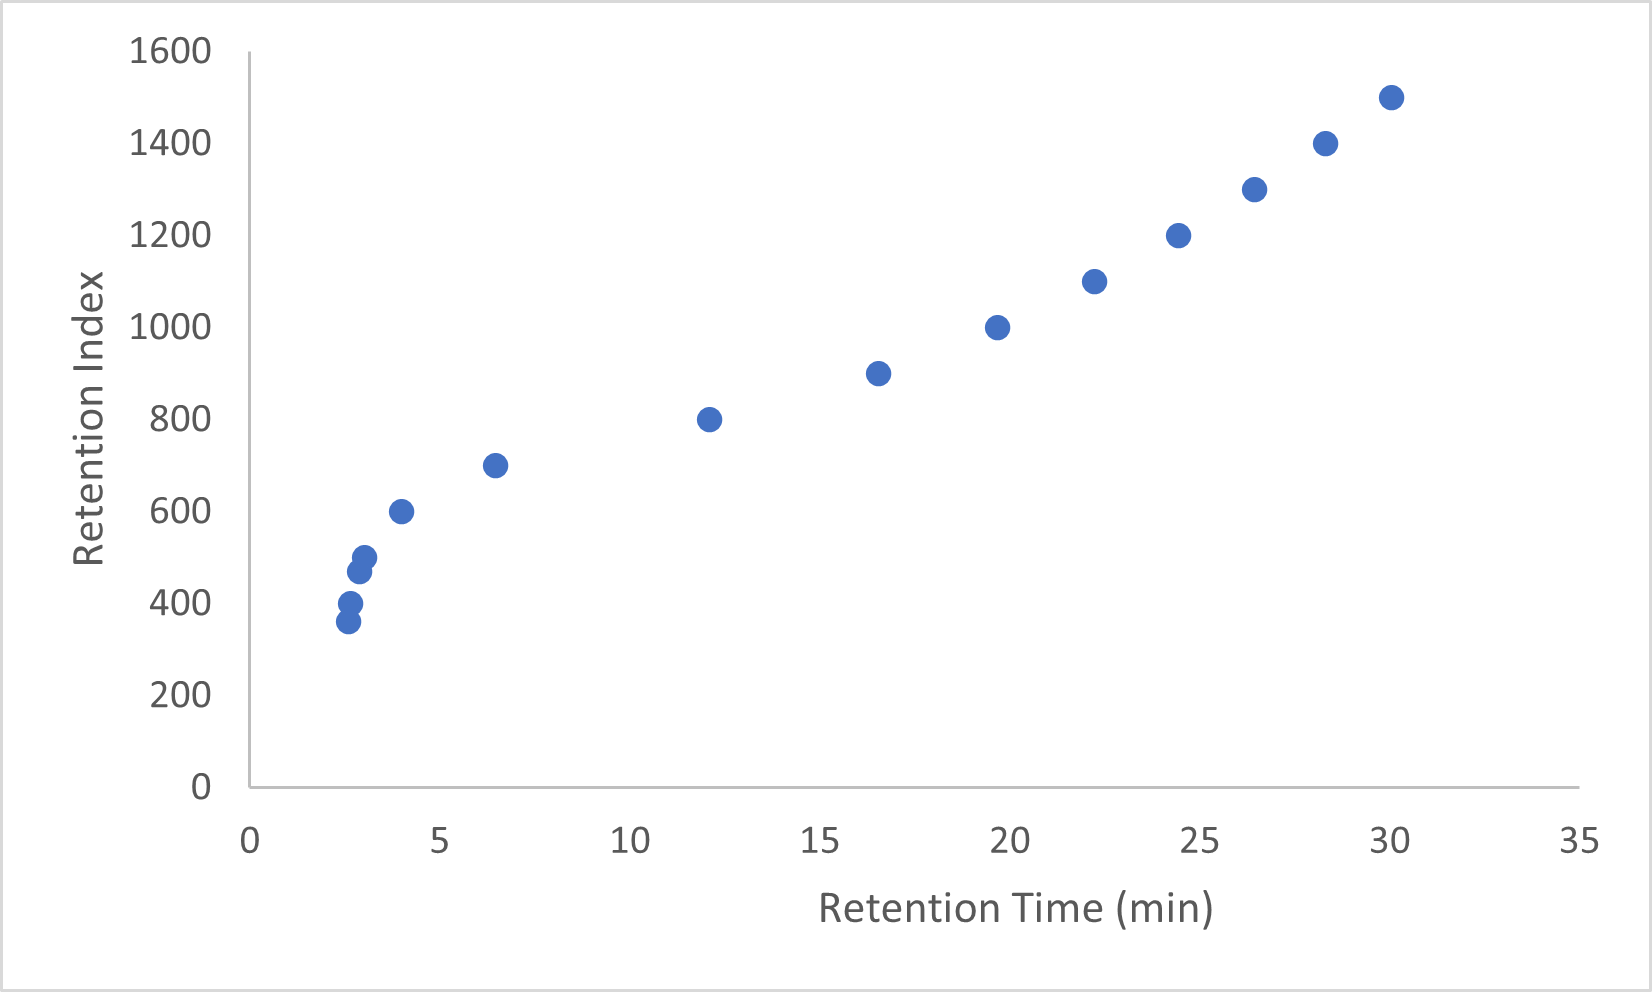
Standardizing your ASTM D8071 Analysis
Chris Cook
In this blog, we cover all standards used in our ASTM D8071 application, how often…
Read More >


Leave a Reply