Published James Diekmann on August 2, 2018
Verifying VUV Spectral Identification
If it’s your first time seeing vacuum ultraviolet absorption (VUV) spectra, one of the first questions you may have is – “How do I know if the identification is correct?”. To answer this question, I’ll share a few tips to increase your confidence in the matching of sample and library spectra.
Since I’m a visual person, the first thing I like to do is the verify the library match – visually. Figure 1 shows sample (measured) and library spectra for benzene, as well as a library spectrum for toluene. You can see right away that the acquired spectrum fits the library spectrum for benzene perfectly, while toluene does not, even though there is an aromatic class similarity.
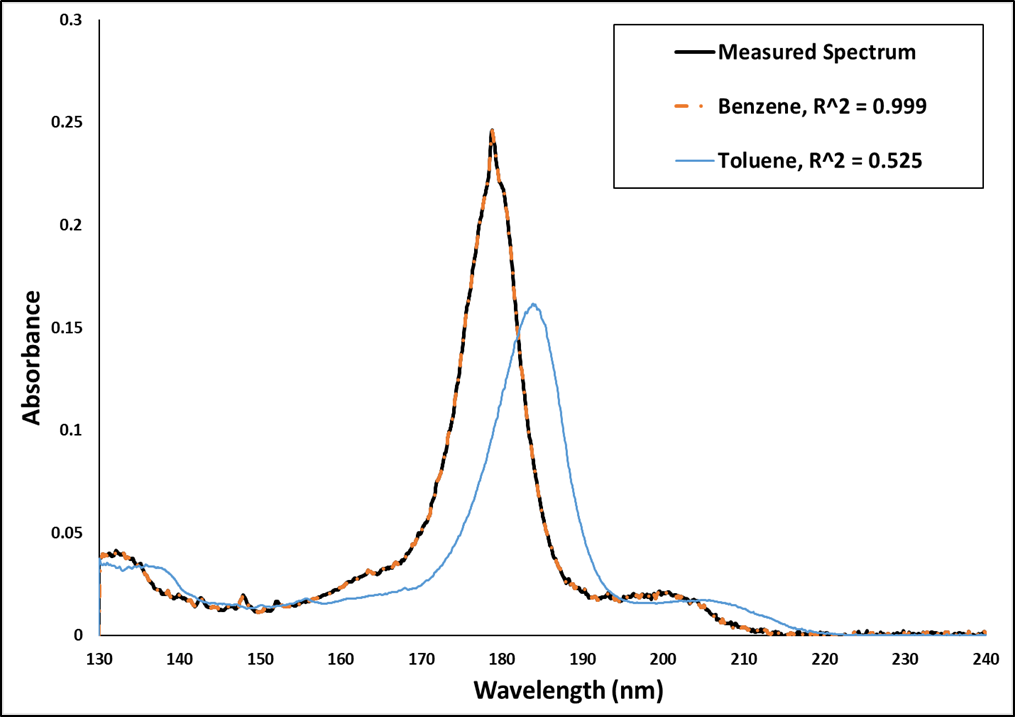
Figure 1. Measured spectrum and two possible library matches: benzene (orange) and toluene (blue), along with their respective r2 values. The benzene library spectrum is essentially a perfect match for the sample (measured) spectrum.
The second thing I like to do is examine the residual, a plot that subtracts the library’s spectral match from the measured spectrum. Figure 2 shows the residuals of toluene and benzene library spectra against the measured spectrum.
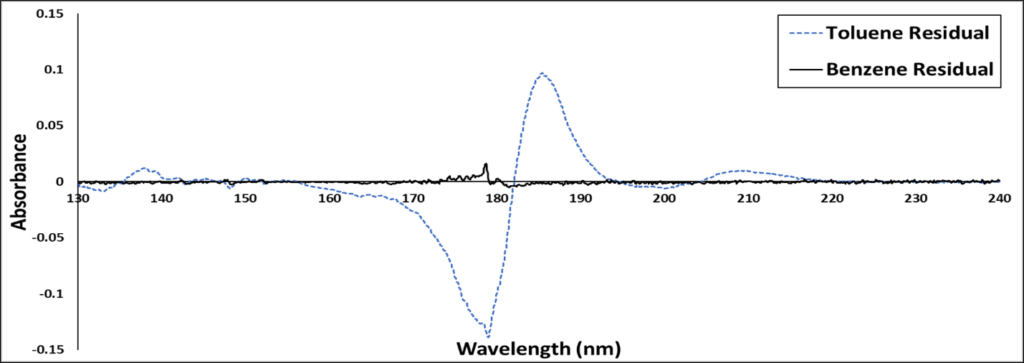
Figure 2. Residuals plot for a VUV-acquired spectrum against library spectra for benzene (black) and toluene (blue). The benzene residual is almost a perfect flat line, indicating an excellent match between sample and library spectra.
Already, you can see a significant difference between the toluene and benzene residuals. Toluene has a large spectral difference from benzene in 170 to 190 nm region, while the benzene residual is almost flat. The flat residual is one more visual indication that benzene is a more appropriate fit.
If the two approaches above aren’t enough, I can also examine the reconstructed chromatogram based on a compound’s VUV absorbance. In Figure 3 we have the acquired benzene peak along with peaks reconstructed from benzene (blue) and toluene (orange) absorbance data. You can see that the reconstructed benzene overlays nicely on the original chromatogram, while the reconstructed toluene chromatogram falls short.
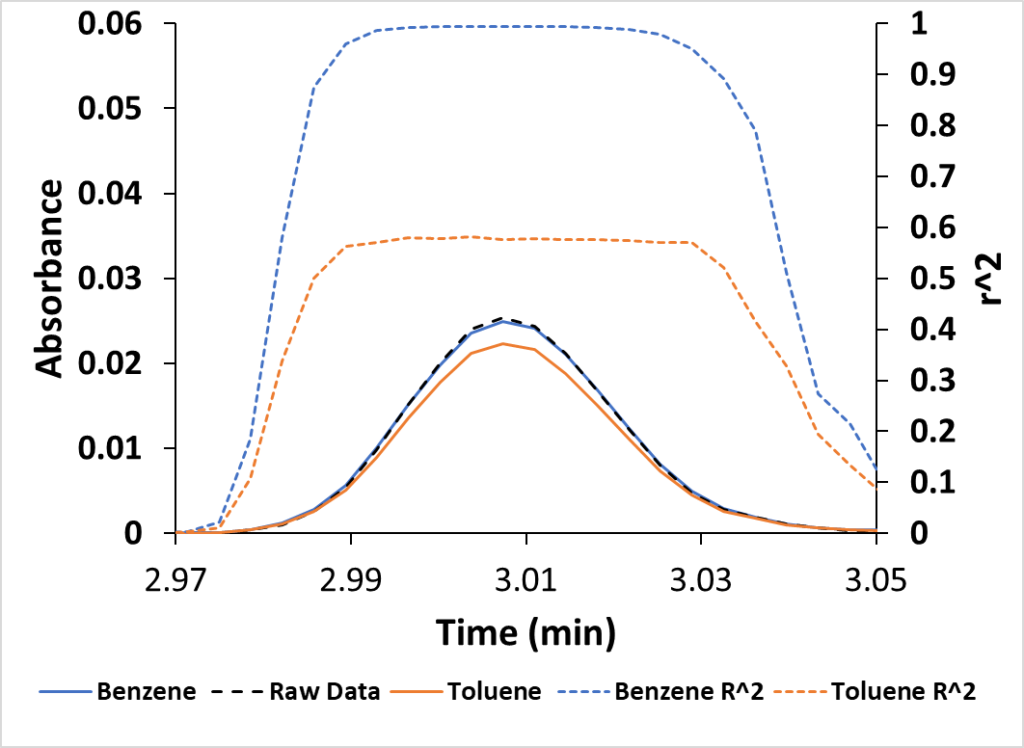
Figure 3. The acquired benzene peak (Raw Data) is much closer to the spectrally reconstructed benzene peak versus the toluene peak. This plot also displays the benzene and toluene r2 fits versus time. Benzene approaches 1, a good fit.
For those of you that are statistically inclined, the VUV software also includes r2and Chi2 values. Here’s information about how the r2 is calculated: Coefficient of determination, and how Chi2 is determined: Chi-squared test. If you want to skip these mathematically deep dives, here’s all you need to know about r2and Chi2 values for VUV spectral matching:
- r2 – The closer to 1, the better the fit.
- Chi2 – The closer to 0, the better the fit.

Table 1. The r2and Chi2 values of benzene and toluene as metrics of acquired and library spectra match are strongly in favor of benzene.
In Table 1, you can statistically see that benzene is a better fit than toluene because benzene’s r2 is close to 1 and its Chi2 is much closer to zero.
To reiterate, here are 3 steps you can use to ensure confidence in your spectral match:
- Visually – Does the library spectrum match the acquired spectrum and does the reconstructed chromatographic peak match the actual chromatographic peak?
- Mathematically – Across the entire wavelength range, is the residual fit for library and acquired spectra close to zero?
- Statistically – Are the r2 and Chi2 values significantly better than the other library matches?
Just keep these simple tips in your back pocket and you won’t have any issues verifying your VUV-identified compounds!




Leave a Reply