Published Alex Hodgson on June 3, 2019
VUV 101: What’s in a Spectrum?
Has one of your children or luddite coworkers ever come up to you, tugged on your sleeve, and asked, “Where do VUV absorbance spectra come from?” Have you ever been curious yourself? In this inaugural installment of the ongoing VUV 101 series, we’ll learn from where we get our iconic VUV absorbance spectra.
The VUV absorbance spectra we see and associate so closely with their analytes are actually differentials. Differentials of what, exactly? For those unfamiliar with the layout of a VGA, the light travels down the length of the flow cell before it hits the detector, the same path as the eluting analytes (Figure 1). In every GC-VUV run, the VGA collects two other types of scans at the start of a run prior to collecting sample scans: a darks scan and a reference scan. The reference scan is essentially the transmission profile of deuterium, the element that fuels the UV lamp (Figure 2a). As molecules pass through the flow cell, they absorb some amount of UV light in a particular wavelength range; the remaining unabsorbed light passes through the flow cell and into the detector, where it’s captured as raw transmission data (Figure 2b). The software then subtracts the raw transmission data from the reference deuterium transmission spectrum, giving us the much more familiar-looking VUV absorbance spectrum of the molecule (Figure 2c).
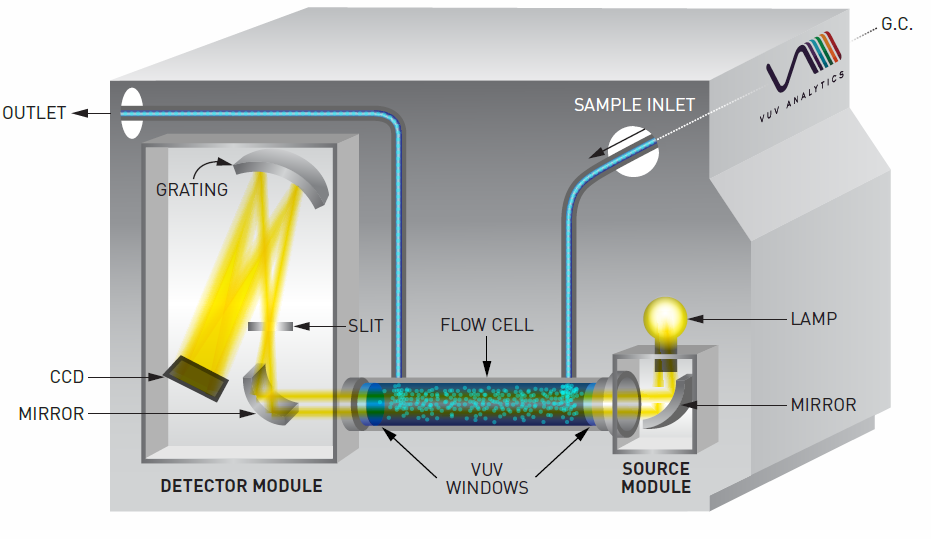
Figure 1. In this VGA schematic, analytes coming from the GC pass through the length of the flow cell before exiting via the exhaust. As they pass through the flow cell, they absorb some of the UV light across a certain wavelength range.
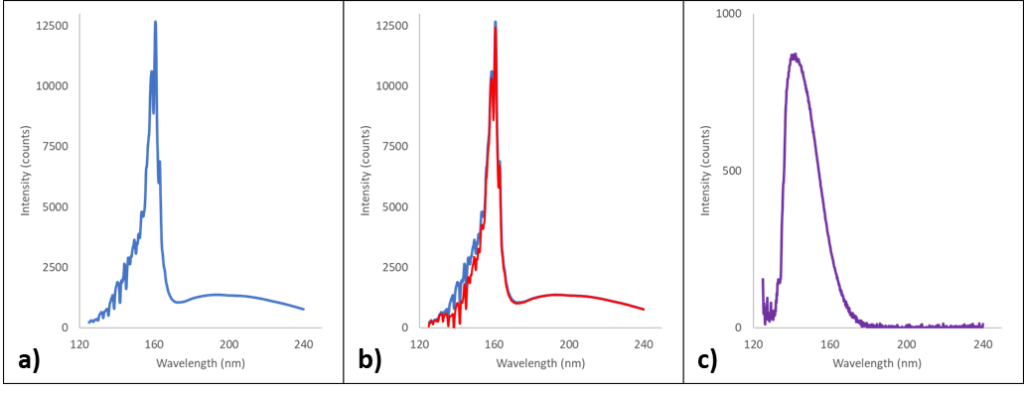
Figure 2. The left spectrum (a) is a reference transmission spectrum from the deuterium lamp. Ideally this takes place when there are no absorbing molecules in the flow cell. The center spectrum (b) is an overlay of transmission data as oxygen molecules pass through the flow cell (red) and the reference spectrum from Figure 2a (blue). The right spectrum (c) is the differential of the reference and acquired transmission spectra, giving us the familiar oxygen VUV absorbance spectrum.
Hopefully you learned a little more about VUV than you did yesterday, and hopefully you can learn more tomorrow! Stay tuned for more bite-sized info on the VUV technology.




Leave a Reply