Published Jack Cochran on October 23, 2017
Anyone who has seen me in action knows I must constantly play around with gas chromatography conditions for any application, even one as well-developed as ASTM D8071-17: Standard Test Method for Determination of Hydrocarbon Group Types and Select Hydrocarbon and Oxygenate Compounds in Automotive Spark-Ignition Engine Fuel Using Gas Chromatography with Vacuum Ultraviolet Absorption Spectroscopy Detection (GC-VUV).
I won’t claim that any of my experiments have improved upon that method, but I can say that I’ve demonstrated to myself its ruggedness for accurate determination of paraffins, isoparaffins, olefins, naphthenes, aromatics (PIONA) in finished gasoline. So I want to give you PIONA GC analysis simplified.
One example involves comparing gasoline analysis under the specified D8071 GC conditions using a 30m x 0.25mm x 0.25µm “one” type column: He carrier at 1 mL/min, oven 35°C (10 min), 7°C/min to 200°C versus a detailed hydrocarbon analysis (DHA) translated method on the same 30-25-25 GC column of He carrier at 1.4 mL/min, oven 35°C (1.5 min), 11.1°C/min to 205°C.
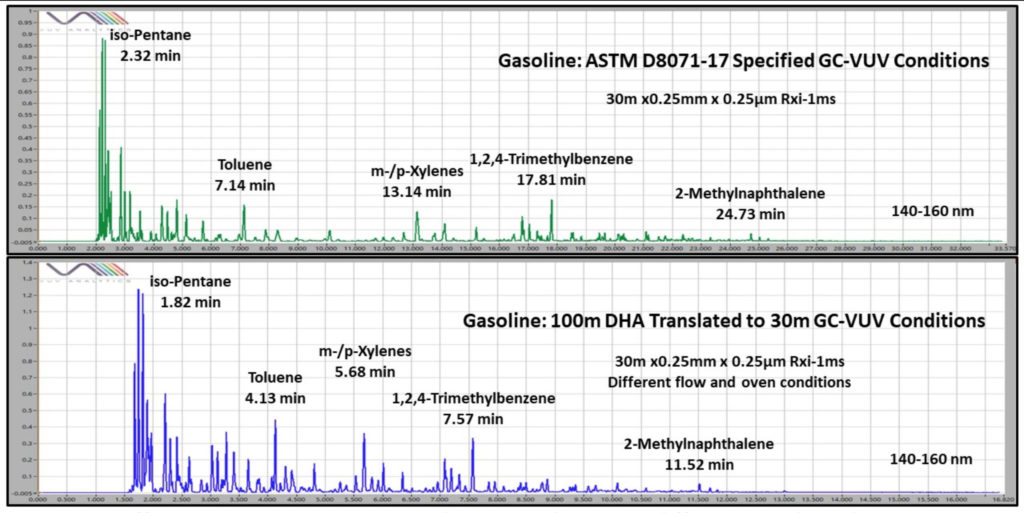
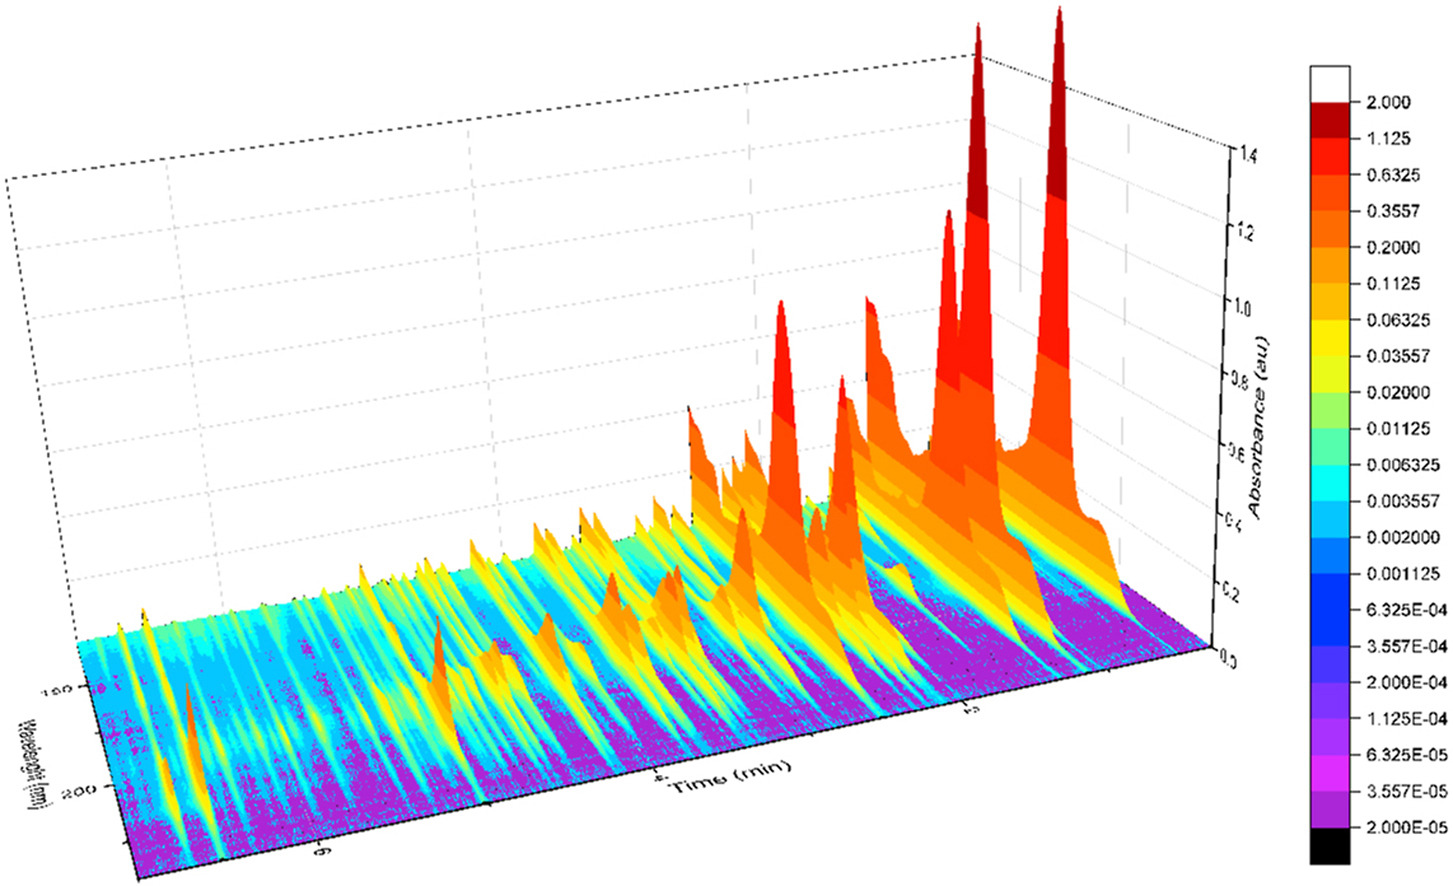
Figure 1: Different GC oven program conditions produce very different gasoline chromatograms, but VUV spectra and VUV Analyze data processing gives the correct PIONA results.
Already you can see that the GC conditions are radically different, leading to much different chromatograms (Figure 1), which might prompt you to believe that the PIONA results would be different, too. Not the case! PIONA and individual compound results for both methods are very similar (Table 1).
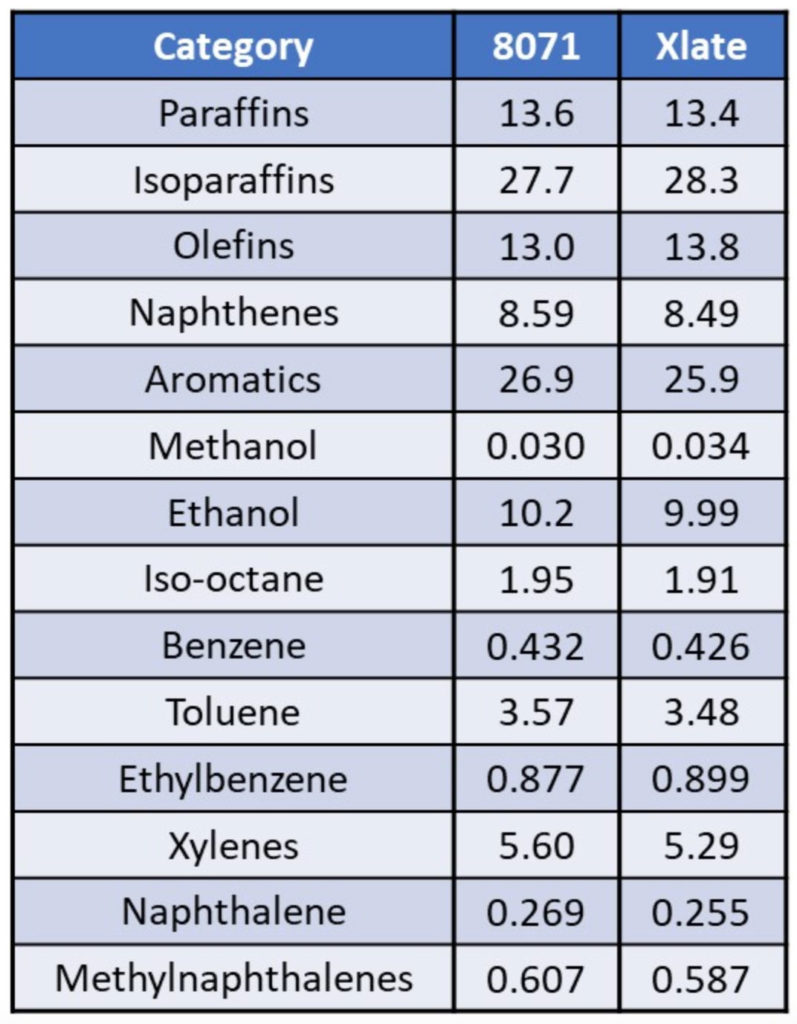
Table 1. E10 gasoline analyzed using ASTM D8071-17: Standard Test Method for Determination of Hydrocarbon Group Types and Select Hydrocarbon and Oxygenate Compounds in Automotive Spark-Ignition Engine Fuel Using Gas Chromatography with Vacuum Ultraviolet Spectroscopy Detection (GC-VUV) compared to a very different detailed hydrocarbon analysis (DHA) translated GC method (Xlate) produce similar PIONA and select hydrocarbon and oxygenate numbers due to the ruggedness of VUV Analyze data processing. VUV absorbance spectra allow deconvolution of coeluting analytes and correct species and class assignments.
Results are in mass %.
At first, I found this remarkable given the retention time differences between analytes for the different GC methods (Table 2), but ultimately it is a testimony to the power of having absorbance spectra for VUV Analyze data processing instead of flame ionization detection (FID).
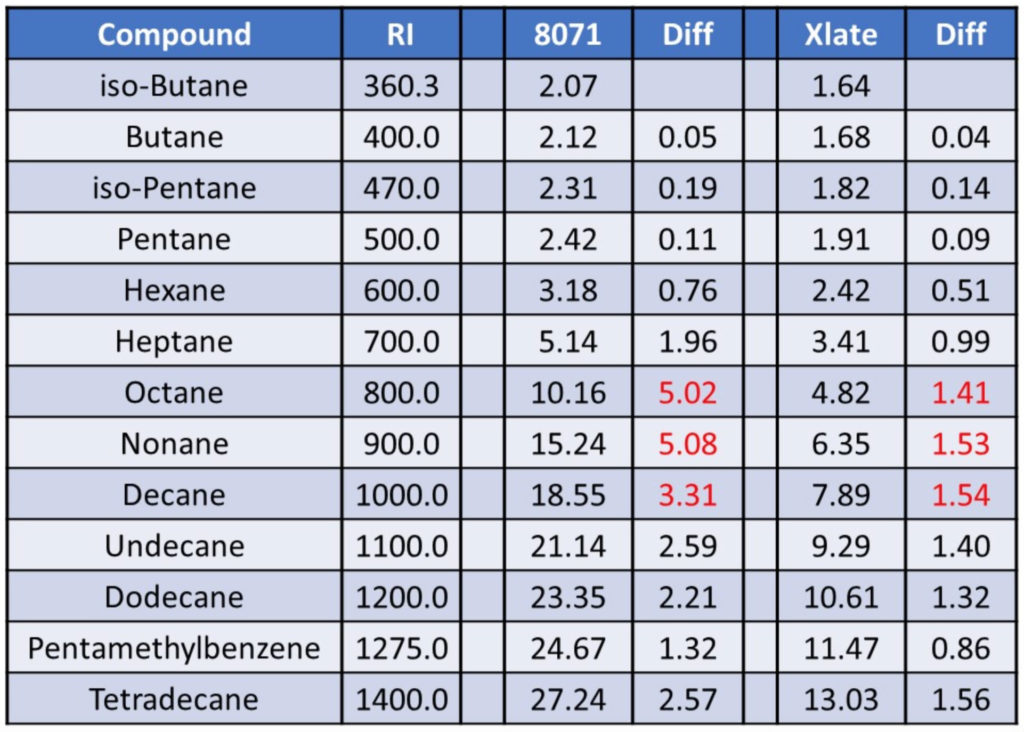
Table 2. Retention indices (RI) and retention times in min (8071 and Xlate columns) for gasoline and System Validation Mixture compounds analyzed using ASTM D8071-17 GC-VUV conditions and method translated GC-VUV conditions from a “DHA-type” analysis. Both analyses are on a 30-25-25 “one” column. Note the dramatic differences (Diff) in retention time separation values.




Leave a Reply