Published by Chris Hernandez on August 3, 2020
If you’ve ever spent much time on our website or speaking with a representative of VUV Analytics, you’ve probably heard us talk about the benefits of three-dimensional data along with the confidence of having higher data accuracy, data that’s easier to interpret, and faster analyses. But what does that really mean? How is that accomplished with 3D data?
Let’s talk a minute about some traditional gas chromatography detection technologies, such as flame ionization detectors (FIDs). FIDs are simple devices, as many readers of this blog probably already know. They simply burn an analyte, and the intensity at which the analyte burns tells you how much there is. Additionally, the amount of time it takes that analyte to reach the FID is used to identify what that compound is, since some compounds take longer to reach the end of a GC column than others. GC-FID is, in essence, a two-dimensional approach – relying on time and intensity.
What would be possible if you could give these peaks some “depth”? What if you could peek around peaks, if you will? Or what if you could slice out a vertical chunk of that peak, rotate it, and see what’s inside of it? That’s exactly what three-dimensional data allows you to do.
While the only data 2D detectors like the FID provides are “how much stuff” and “how long did it take to come out of the column”, VUV spectroscopy provides the added dimension of “what it is”. At the risk of sounding like a broken record, our detectors capture the spectral fingerprint of an analyte – a fingerprint which can be used to positively identify compounds.
It’s with this added dimension that the VGA-100 & VGA-101 provides that allows you to literally see more. Let’s take detailed hydrocarbon analysis (DHA) for example, which uses a very long separatory column and a single FID (plus an additional pre-column in some cases). This analysis can take about 140 minutes for the first step of separating the compounds, followed by an additional step where a skilled operator must interpret the data. The reason for that extra-long run time is because every compound must be separated by the time it gets to the FID. Otherwise, if two compounds came out at the same time, how would you know? But what if you didn’t have to completely separate everything? What if you could see what was behind the peak? It means you don’t need to have long run times to separate everything.
A really good example of this is in the case of critical pairs, such as benzene and 1-methylcyclopentene. These are compounds that are known to elute very close together in a DHA analysis unless a pre-column is used, and in our Verified Hydrocarbon Analysis™ (VHA) method, they actually elute at the same time! And we’re okay with that! This is because the spectral fingerprint allows us to pinpoint precisely what is coming out of the column. Figure 1 shows a coelution occurring at 9.207 minutes during a Verified Hydrocarbon Analysis (VHA) run, and this figure shows how it would appear when dealing with only two-dimensions – time and intensity. Even if you knew these two compounds are coming out at the same time, you would not be able to confidently determine the quantities of either compound. But, if we add the third dimension of VUV spectral fingerprints, we can see something interesting happening. Figure 2 shows what happens if we take that peak and rotate it slightly. We can see that, along the wavelength axis, there’s some absorbance in the lower wavelengths around 125 – 135 nm and a prominent feature centered near 180 nm. This captured spectra is in fact the sum of the benzene and 1-methylcyclopentene spectra. Figure 3 shows what those combined spectra look like.
Fortunately for our users, the applications we develop automate this entire process of identifying these spectra and quantifying the analytes. It’s with this added dimension of spectral identification that enables our users to compress their GC run times, automate data analysis, and be confident in the accuracy of data they collect.
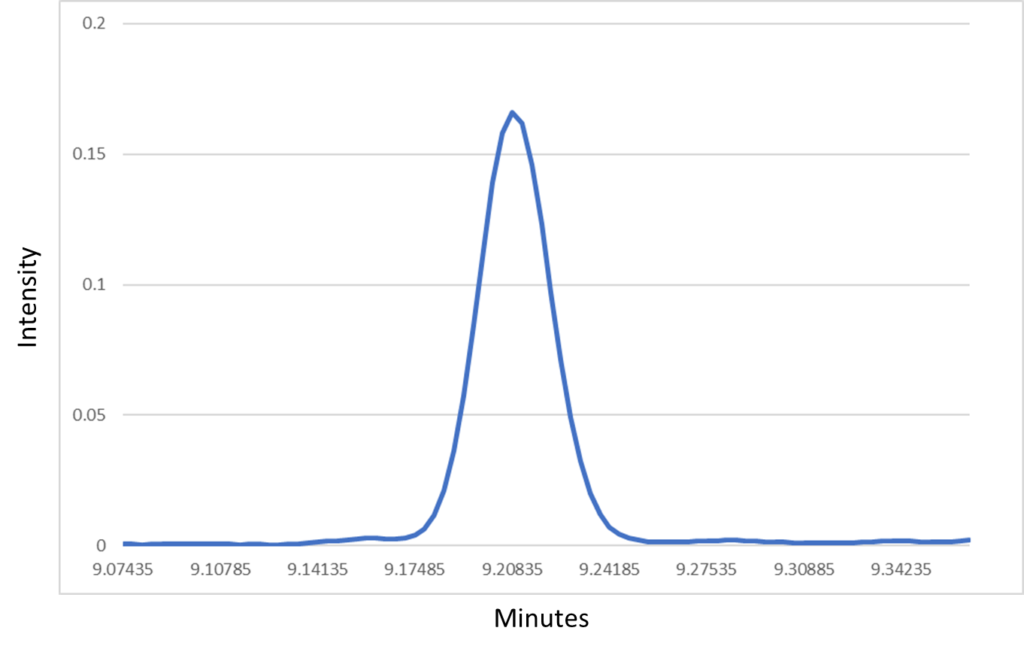
Figure 1: This peak is the coelution of benzene and 1-methylcyclopentene. It’s impossible to see that this is more than a single compound when limited to 2D data.
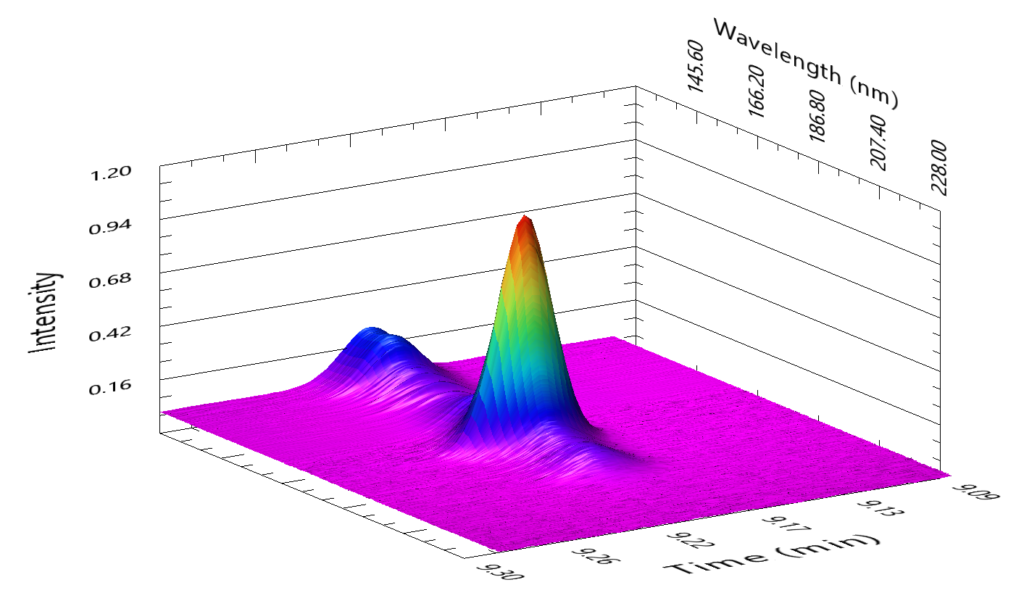
Figure 2: By adding the third dimension of VUV spectra and adjusting your perspective slightly, you can see that there is more to this peak than meets the eye
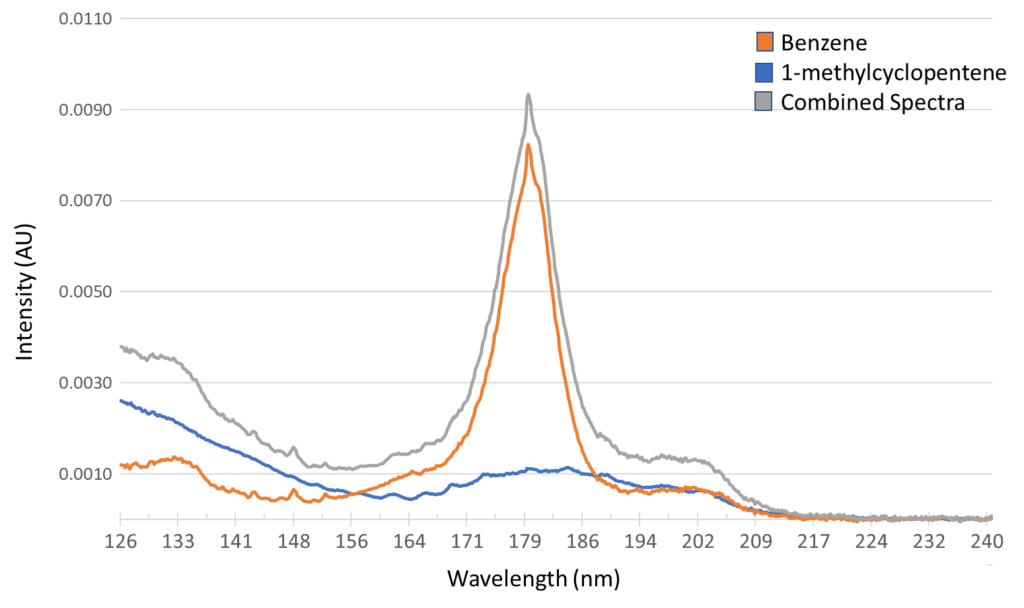
Figure 3: Spectral deconvolution allows us to see that this coelution consists of two separate compounds – benzene and 1-methylcyclopentene.



Leave a Reply