Published James Diekmann on August 2, 2018
GC-VUV versus UV-Vis Spectroscopy & Synchrotron Labs
To get a better grasp on VUV technology, I believe it is important to compare VUV spectra to technologies that have already probed near or around the vacuum ultraviolet region (e.g. ≤200nm). Two examples come to my mind: synchrotron laboratories and UV-Vis spectrophotometers.
Synchrotron laboratories are ginormous multi-billion-dollar facilities that house huge magnets to accelerate charged particles. Consequently, as these particles accelerate to very high speeds, they release energy in the form of light, dubbed synchrotron radiation. This radiation can be used to probe the electronic states of molecules, yielding an absorbance spectrum spanning from 100nm to 300nm.
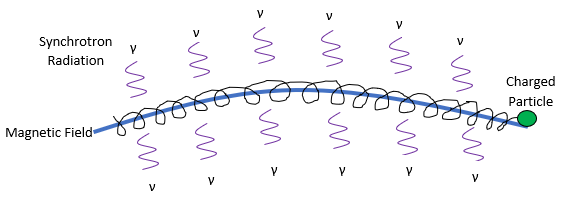
Figure 1. is a crude drawling of a charge particle (green) following a magnetic field (blue). As it accelerates around the magnetic field, it releases synchrotron radiation (purple).
UV-Vis spectrophotometry uses UV-Vis radiation (200nm – 400m) to probe a small amount of liquid in a sample cell. The remaining unabsorbed light is then used to fingerprint the compound of interest, shown in Figure 2.
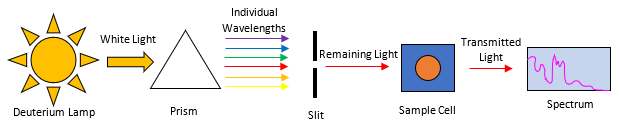
Figure 2. is a simple representation of a UV-Vis spectrophotometer. As light from a deuterium lamp is sorted through a prism/diffraction grating, a slit is used to isolate a subset of wavelengths, which are absorbed in the sample cell. The transmitted light from the sample cell is used to produce an absorbance spectrum.
Similarly, VUV spectroscopy probes gas phase molecules (125-240nm for the VGA-100 or 125-430nm for the VGA-101), emerging from a gas chromatograph. The remaining, unabsorbed light is used to produce a spectral fingerprint shown in Figure 3.

Figure 3. is a simplified version of the VUV spectrometer. As effluent from the GC enters the flow cell, light from the deuterium lamp is absorbed by the compound. The remaining (transmitted) light strikes a diffraction grating, resolving the individual wavelengths, which is then collected on a CCD, producing an absorbance spectrum.
Now that we know the differences between synchrotron, UV-Vis and VUV, how does VUV spectra compare to data produced from a multi-billion-dollar synchrotron facility and a commonly use UV-Vis spectrophotometer? Well, let’s examine anthracene. Figure 4 shows a composite of synchrotron (green), UV-vis (blue), and VUV (black) spectra. Notice how synchrotron radiation captures the shorter wavelength ranges (140-300nm), while UV-Vis captures the longer (300-370nm). Nicely enough, where the synchrotron spectrum ends, the UV-Vis spectrum picks up. But what you should notice is how VUV covers the entire range (130-430nm)! Just think, VUV technology (specifically the VGA-101) is able to generate spectra similar to a multi-billion-dollar synchrotron facility and a UV-Vis spectrophotometer.
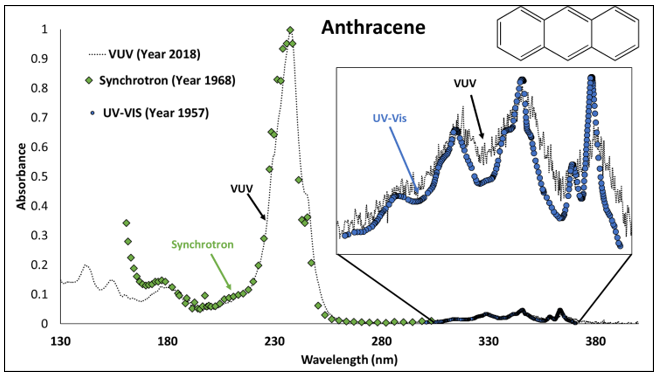
Figure 4. A synchrotron (green), UV-Vis (blue), is overlaid on the VUV spectrum (black) of anthracene. Theses spectra were obtained from Mainz’s, NIST, and VUV Analytics Inc., respectively.
Author

James Diekmann
James Diekmann is currently an Application Scientist for VUV Analytics. He has been with VUV Analytics for over 4 years and is recognized as an expert in GC-VUV. Currently, he focuses on headspace analysis for volatile compounds in complex matrices such as blood. Previously, he worked on hydrocarbon characterization in gasoline-range petroleum analysis using GC-VUV. He has a B.S in Physics and Astronomy from the University of Texas at Austin.
Related Reading
Obtaining Quality VUV Spectra using VUVision Software
Chris Hernandez
This blog outlines what must be considered when adding a compound to your user library…
Read More >
Convolutional neural network for preprocessing‐free bacterial Spectra identification
Journal of Chemometrics
This publication from the Journal of Chemometrics that talks about a unified solution for the…
Read More >
Standardizing Your Analysis: ASTM D8267 Standards
by Chris Cook
In this blog, we discuss the importance of all standards used in our ASTM D8267…
Read More >


Leave a Reply