Published Ryan Schonert on October 21, 2020
Good peak shapes are critical for optimal chromatography. They affect sensitivity and increase the number of resolvable peaks in a GC run, both of which add value to an analysis. Usually, bad peak shapes originate from a GC issue, but since it’s also possible for the GC detector to be the culprit, we carefully check the peak shapes from each VGA unit before shipment.
What are proper peak shapes?
Ideal peaks are thin, tall, and Gaussian in shape. Analysts might spend significant time optimizing their chromatographic runs to get peaks with these characteristics. Why? It helps each peak to stand out from the baseline noise and surrounding peaks in the chromatogram. Thin and tall peaks are more easily distinguishable from noise, yielding better signal-to-noise ratios than wider, flatter peaks. Additionally, while we’re able to analyze more peaks per run than other techniques thanks to spectral deconvolution, optimizing peak shapes will strengthen the analysis even further.
Bad peak shapes may have several causes. Some of them include:
- Column contamination
- Solvent-phase mismatch
- Adsorption to sample composition
- Improper injection
- Column overload
- Incomplete column coating
- System activity
- Uneven heating in the detector*
- Obstruction in the flow path*
The last two potential causes pertain to the detector. For example, peak tailing caused by these issues are visualized in Figures 1 and 2.
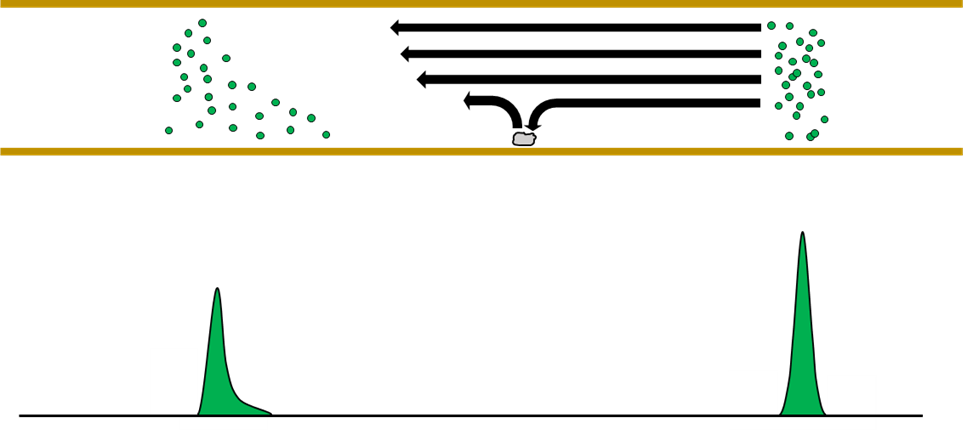
Figure 1. Diagram of peak tailing caused by an obstruction in the flow path. Some of the sample’s molecules may collide and interact with particles present in the transfer line or flow cell, causing them to lag behind.
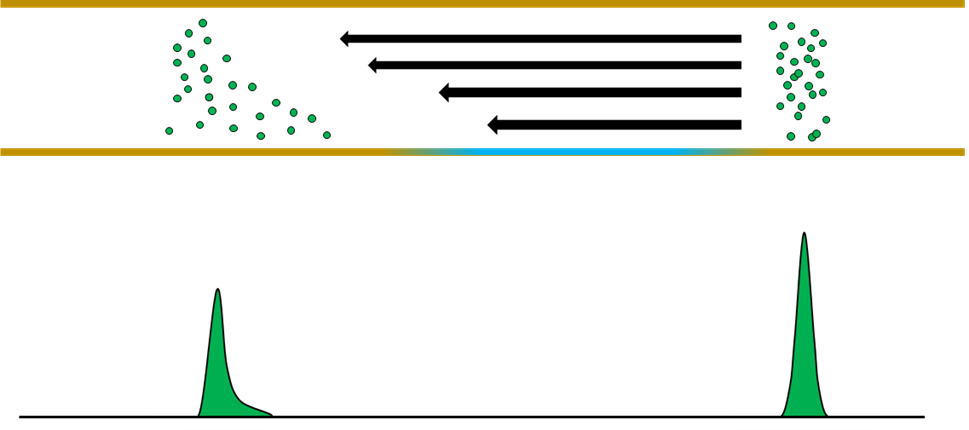
Figure 2. Diagram of peak tailing caused by uneven heating in the flow path. A cold spot in the transfer line or flow cell will slow some of the sample molecules relative to the others.
How do we check peak shapes?
We use a DRO-ORO standard (diesel range organics – oil range organics) to check the peaks being recorded by each VGA. This standard includes straight chain hydrocarbons that should elute with reliably symmetrical peak shapes on a type-1 column. The shapes of the DRO-ORO peaks, especially the heaviest hydrocarbons in the standard, help us evaluate the detector. Figure 3 illustrates an example of good and bad peak shapes.
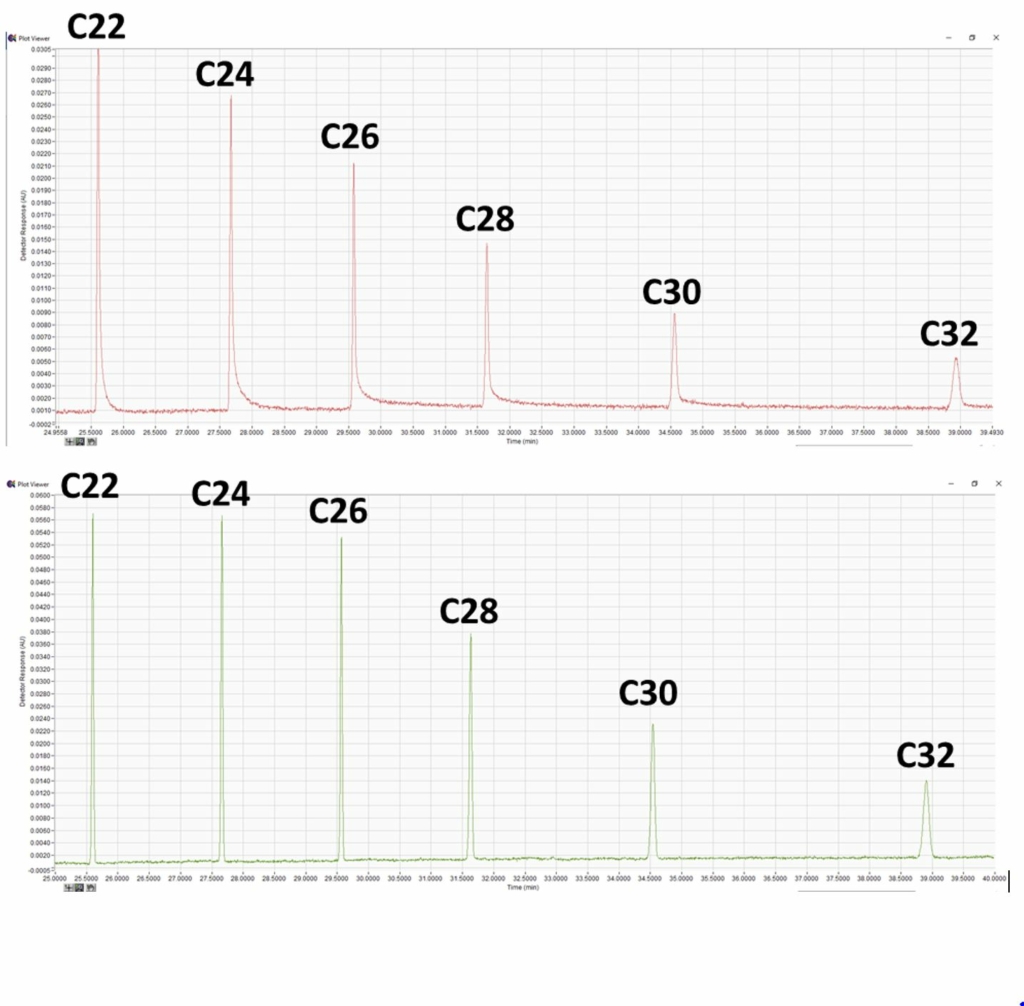
Figure 3. Sample chromatograms showing ideal peaks (top) and tailing peaks (bottom). The heaviest components of the DRO-ORO standard are particularly prone to the effects shown in Figures 1 and 2, giving easily visible signs of issues within the flow path.
Once we identify these issues during the qualification process, the transfer line and/or flow cell can be examined and replaced, if necessary. Many times, a simple transfer line column change can fix the issue, but we make sure each system is generating good peak shapes before shipping. Additionally, we commonly employ this test during installation and troubleshooting, as it’s a quick and easy diagnostic tool.
In my past few blog posts, we’ve covered some simple tests designed to assess specific aspects of the detector. In the next post in this series, we’ll cover some more general tests meant to evaluate the instrument’s performance as a whole. Stay tuned!
Author

Ryan Schonert
Ryan Schonert is currently an Application Scientist for VUV Analytics. Prior to joining VUV Analytics, Ryan performed research on the extraction and characterization of additives in smokeless powders using GC-MS and SEM-EDS. He earned a B.S. in Chemistry from Illinois Wesleyan University and an M.P.S. in Forensic Science from the Pennsylvania State University.
One response to “VGA Instrument Qualification – Checking Peak Shape Quality”
Leave a Reply
Related Reading
Exploring the Data View Window in VUVision™ Software Part 3
Chris Cook
This blog is the final in the series on the VUVision Data View Window. This…
Read More >
Verified Hydrocarbon Analysis: Synergy Between DHA and VUV
Ryan Schonert
In this blog, Ryan talks about the many benefits of the Verified Hydrocarbon Analyzer as…
Read More >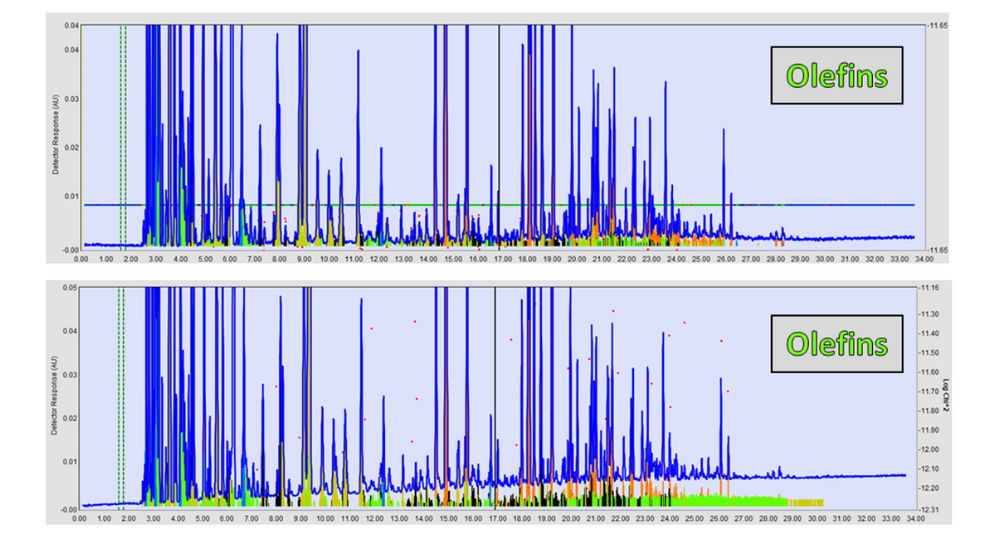
VGA Instrument Qualification – Complex Compositional Analysis & Final Checks
Ryan Schonert
This blog discusses the final steps in instrument qualification by using test samples to check…
Read More >


very useful