Published Chris Cook on September 8, 2020
In a recent post, we covered rising baselines and the problems they can cause when doing analysis with VUV Analyze™ Software. In this post we will discuss another common problem affecting VUV Analyze results, which is when the analyte retention times in the run do not correspond to the times predicted by the retention index (RI) file. We will discuss symptoms of RI file issues, how to go about confirming the problem, and steps to correct the issue.
RI Files and Time Interval Deconvolution™ (TID™)
VUV Analyze works using Time Interval Deconvolution (TID). The chromatogram is broken down into regularly spaced time intervals, each with a unique summed absorbance spectrum. TID then determines what analyte(s) make up the spectrum in each time slice. When the library search is done to match the spectrum of a time slice, the search is limited to the analytes expected to elute within a set time window of the time slice being examined. The RI file is how VUV Analyze knows what analytes to look for in the given time slice. If there is a discrepancy between when analytes are eluting and when they are expected to elute based on the RI file, the analysis will not be accurate. This can appear as a high area reject percentage or as inaccurate results.
Examining a run file for poorly fit time slices
To see exactly how a retention time issue could affect analysis, we will want to have a closer look at the individual time slices analyzed. After VUV Analyze has analyzed a run from production mode, we will change to R&D Mode, accessed by pressing Control+Shift+R. When reviewing time slices it is helpful view the Log Chi2 values as well as the fit statuses of the time slices in the chromatogram plot. To add these features, we first click the gear icon, bringing up the Graph Configuration window, and make the Log Chi2 values visible in the Error Metrics tab (Figure 1). Next, we left click on the top and bottom values on the Y-axis to set those to range from -9 at the bottom of the plot to 0 at the top. Then we add all fit statuses and commit the changes (Figure 2).
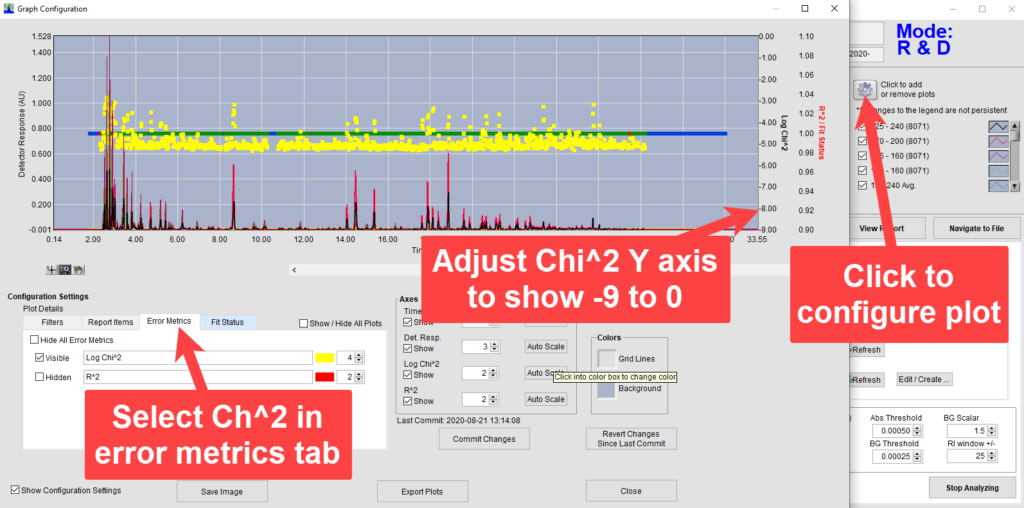
Figure 1. Adding error metrics to chromatogram plot.
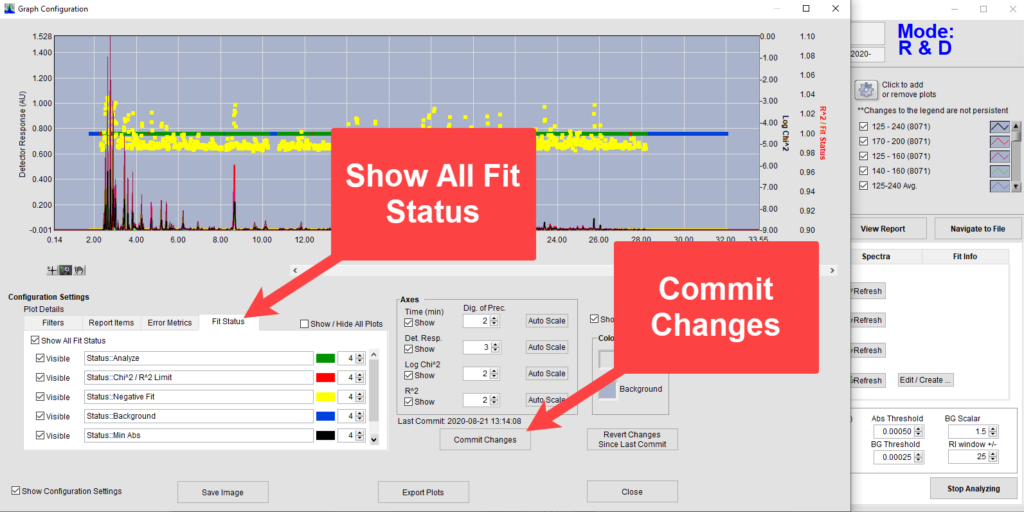
Figure 2. Adding Fit Statuses to chromatogram plot.
Poor fits are noticeable either by a high Log Chi2 value, when the fit is not so bad that a time slice is rejected, or by a red fit status, when the time slice did not meet the minimum fit required by the analysis parameters. Log Chi2 values generally rise and fall with the peak intensity. When we see either a red fit status or high Log Chi2 at either end of a peak, this can indicate that the analyte in the peak was not fully covered by the retention index window of the search. For example, in Figure 3 we see that the time slice at ~2.61 min has a higher Log Chi2 value than the time slices around it.
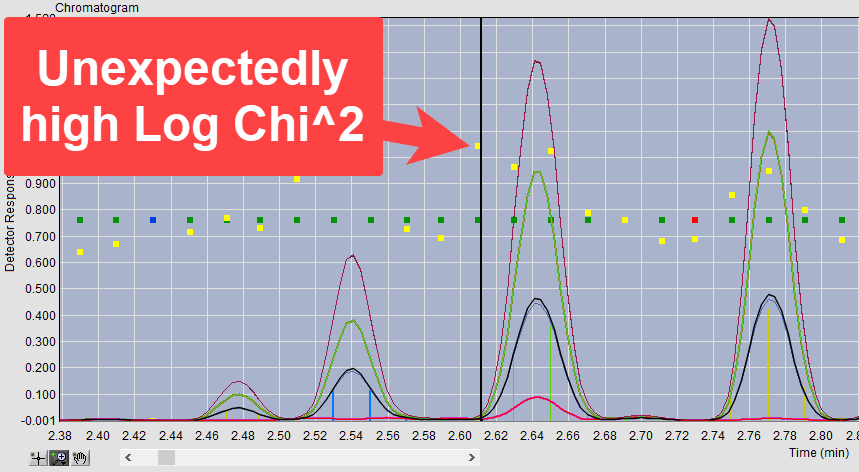
Figure 3. Unexpectedly high Log Chi2 value for time slice at the beginning of a peak
We next select the cursor tool and then click in the chromatogram plot on this time slice to view it. Going to the spectra tab (Figure 4), we see that the fit area (blue fill) does not match with the absorbance spectrum of the time slice (green line). Clicking on the adjacent time slice to the right, we can see that the analysis did a good job of fitting a spectrum with that same shape elsewhere in the peak, shown in Figure 5. The analyte in question is in the library being used, but it is not being searched for in all the time slices in which the analyte is present.
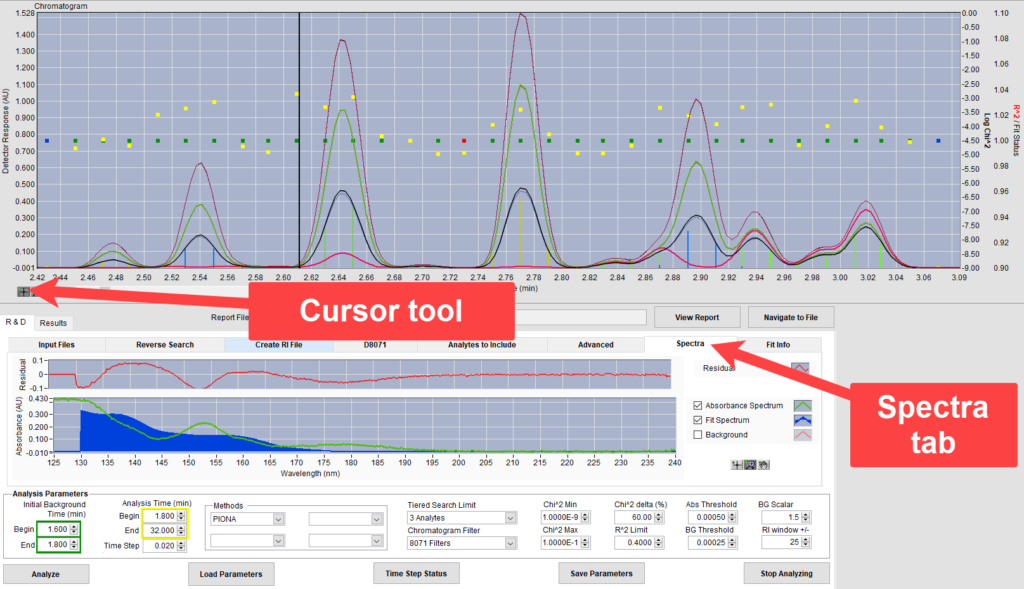
Figure 3. Unexpectedly high Log Chi2 value for time slice at the beginning of a peak
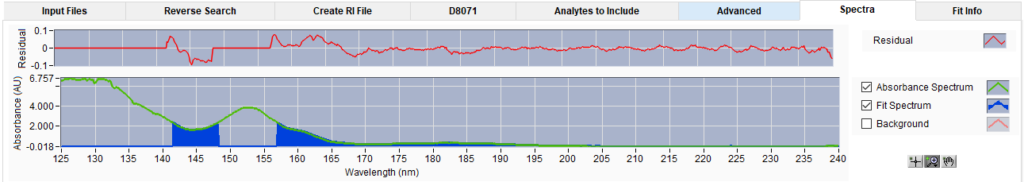
Figure 5. Absorbance spectrum of time slice to the immediate right of the one shown in Figure 4. There is absorbance saturation, but the blue fit area looks to fit the absorbance spectrum.
This issue could be caused by a problem with the retention index file, but it could also be caused by a problem with time range limitations in our Analytes to Include (ATI) list. The ATI list can be used to add individual compounds to the analysis, or to specify a time window for when to look for a particular analyte. The analysis shown here was an unmodified D8071 PIONA analysis, and it did not have any analytes designated in the ATI list. Checking the ATI list in this situation confirms that we have no analytes selected, so the source of the problem is likely the RI file. For further confirmation of this we will check our RI values and verify them in VUVision™ Software.
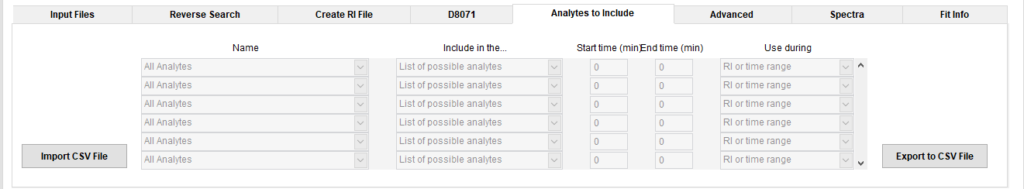
Figure 6. Analytes to Include tab where analyte time range limits would be shown.
Finding analysis RI times
VUV Analyze reports, whether pdf or plain text, always include the RI file information with the retention times used in the analysis. An example from the pdf report is shown in Figure 7.
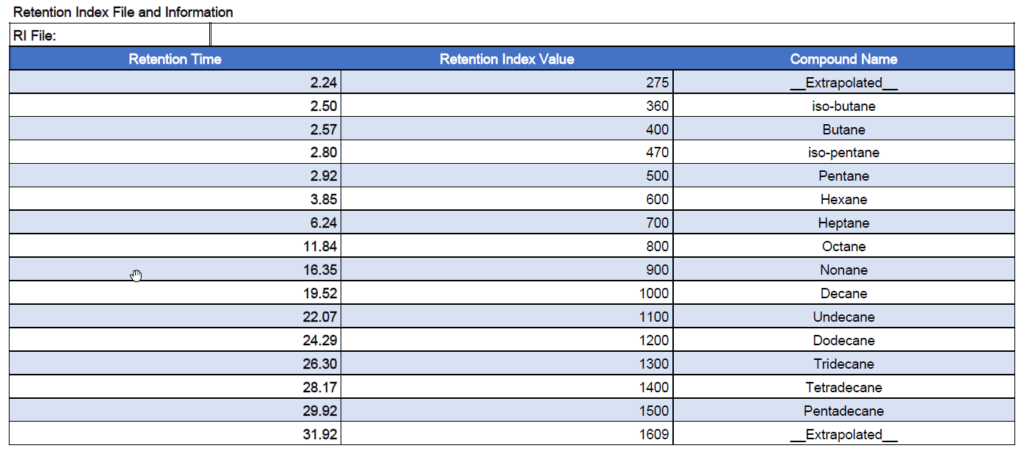
Figure 7. Example RI file values from a D8071 PDF report.
Examining the file in VUVision
We next load the file in the Data View window of VUVision. Double clicking on the first few peaks of the Peak List we find several analytes from our RI file, and the Retention Indexes for all of them have shifted a bit from what was seen in the RI file. For example, the isopentane was predicted at 2.80 minutes from the above RI file, but here we see it eluting at 2.77 minutes. Shifts of 0.03 minutes or more should be investigated to examine possible causes.
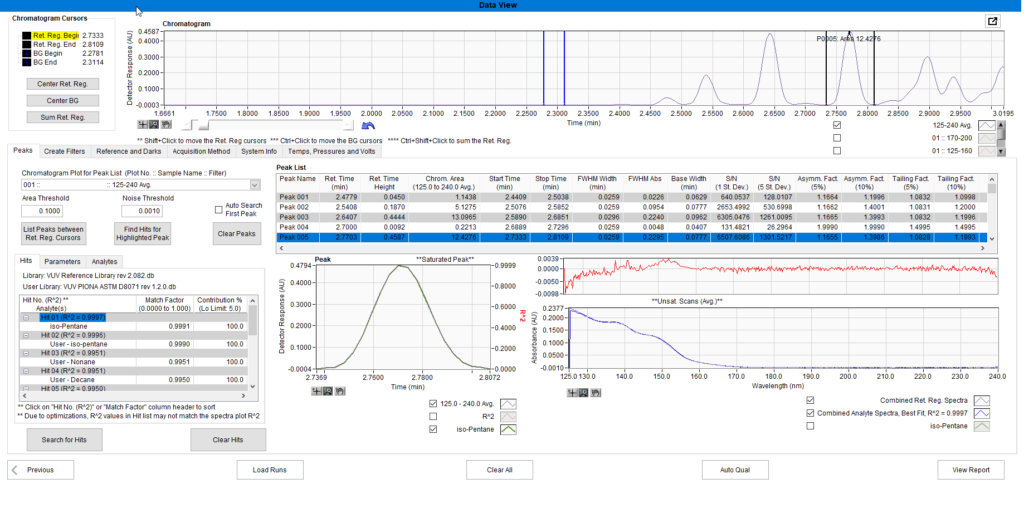
Figure 8. Iso-pentane appears in both the RI file and the run file being analyzed. The retention time is slightly off what was seen in the RI file.
Possible Causes of retention time shifts
The only setting on a VGA that will cause any change in retention time is the makeup gas pressure. Increased makeup gas results in increased backpressure on the column and thus increased retention times. A large change in makeup gas pressure can affect retention times accordingly. If the wrong acquisition method was used (for example the acquisition method for ASTM D8267 jet analysis was used with an ASTM D8071 PIONA sample), the difference in the makeup gas pressures between the two methods might be enough to shift retention times.
Other causes of retention time shift come from the GC. The GC method should be checked to ensure that all settings are correct. Using the wrong column dimensions on the GC is a common source of problems. Leaks close to the inlet, such as holes in the septum, will result in analytes taking longer to elute. Column aging can also cause slight changes in retention times. If GC problems have been ruled out and the VGA acquisition method is correct, the VUV-RT should be rerun to obtain a new RI file and production file.
This post covered the problem of VUV Analyze only missing parts of peaks. If the analysis is missing entire peaks for reasons not relating to retention time issues, it is possible an analyte is not in the library being used for analysis. For discussion of this issue and how to resolve it, see GETTING TO KNOW VUV ANALYZE™, PART 1.
2 responses to “Retention Time Issues in VUV Analyze Software Applications”
Leave a Reply to Walter Spieksma Cancel reply
Related Reading
Standardizing Your Analysis: ASTM D8267 Standards
by Chris Cook
In this blog, we discuss the importance of all standards used in our ASTM D8267…
Read More >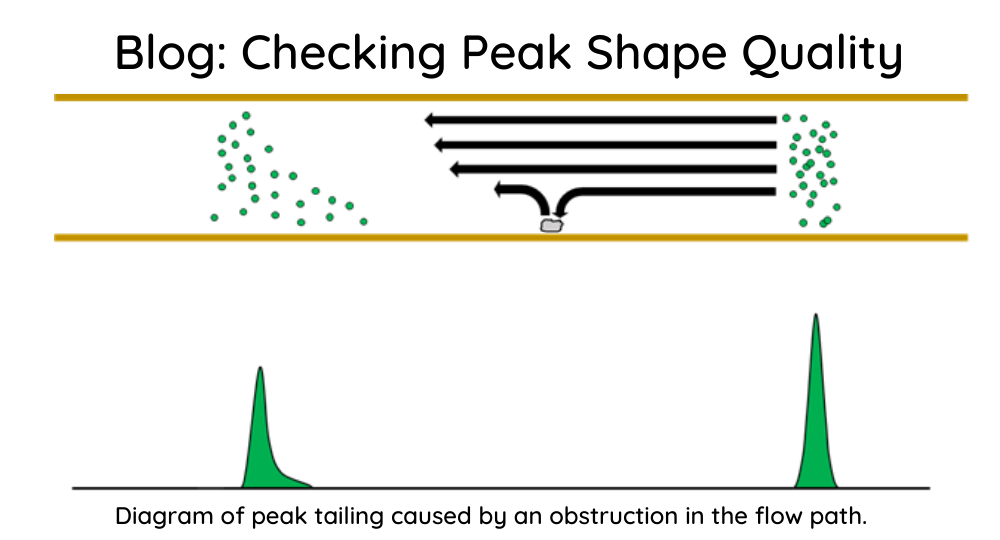
VGA Instrument Qualification – Checking Peak Shape Quality
Ryan Schonert
This blog discusses the importance of good peak shapes for optimal chromatography and how the…
Read More >
Exploring the Data View Window in VUVision™ Software Part 3
Chris Cook
This blog is the final in the series on the VUVision Data View Window. This…
Read More >


Thanks for this outline !
I don’t grasp how Chi^2 works exactly, this should result in zero for exact correspondence between experimental and database spectrum ? (apparently not).
I am more a chromatographer. Could you please consider to update te Kovats calculations in VUV ?
Based on the VUV database time table I get an iC5 Kovats index of 467.1, with a linear Kovats equation I get 465.7 but the iC5 Kovats is 470 according to Fig7. Facing the problems of gasoline separation on a single column, please use the Wikipedia TPGC definition of the Kovats index for measured and database Kovats index ! That is one problem less, solved forever. I would be happy to join you to keep your chromatography sharp and analyse faster while staying comparable to analytical standards !
Hi Walter, thank you for your comment!
The Chi^2 is a goodness of fit (https://en.wikipedia.org/wiki/Goodness_of_fit) metric calculated as Chi^2 = ∑[((Raw-Fit)^2 x weighting function )/# of data points]. This would result in a zero value for a fit perfectly matching a library spectrum. Looking at the Log Chi^2 makes for easier viewing of the plot. Normal Log Chi^2 values in an analysis are around -5 to -4.5, with increases where there are saturated peaks or bad fits.
We source our RI values from a variety of places, primarily from the NIST WebBook (https://webbook.nist.gov/chemistry/). In VUV Analyze applications the RI values are not used for identification, but are rather used to select a subset of the library to search for fitting the time slice data. Because of this, and because our applications tolerate such a large RI windows (+/-25 for PIONA and Jet), these small RI value variations do not affect the analyses.