Published James Diekmann on February 4, 2019
Coffee is a beverage that people all over the world consume. Whether you like dark, medium, or light blends, it all comes down to the roast. Roasting coffee transforms green coffee beans into the traditional black beans we see at coffee shops and stores. From there, the coffee beans are ground and hot water is added to extract the vibrant compounds, creating that lovely cup of coffee we all enjoy.
It’s not surprising coffee is an active area of research in food chemistry. The aroma of freshly roasted coffee easily consists of more than 1,000 chemical compounds. So, what compounds are important and why? Obviously, studies on health effects of coffee compounds are of high priority, especially for furan. Furan is an aromatic compound that is toxic, a pollutant, and potentially carcinogenic for humans. It’s generated during coffee bean roasting and can linger in the beans and ground coffee. Interestingly, coffees made from expresso and coffee-capsule machines contain more furan than traditional drip coffee makers. However, the levels are still considered safe for consumption.
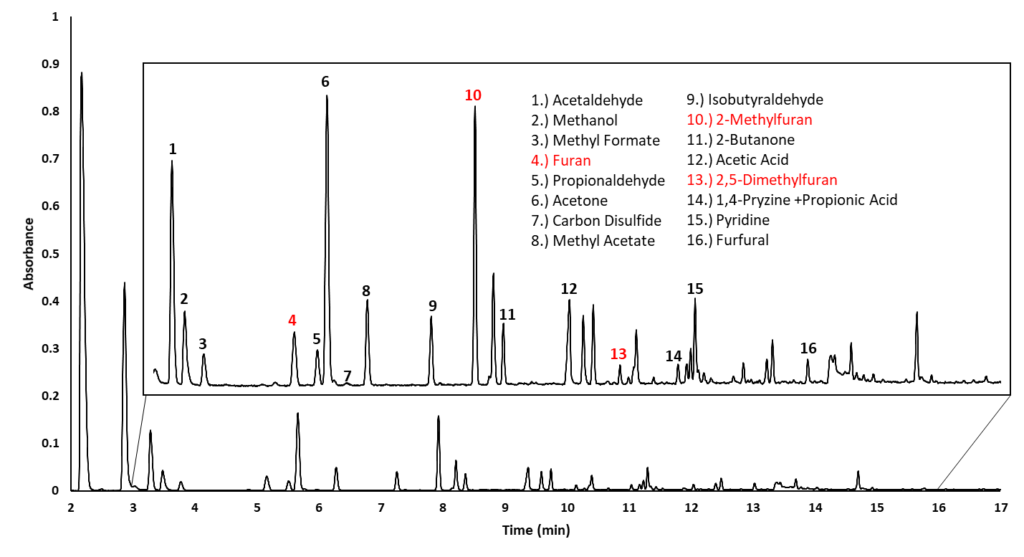
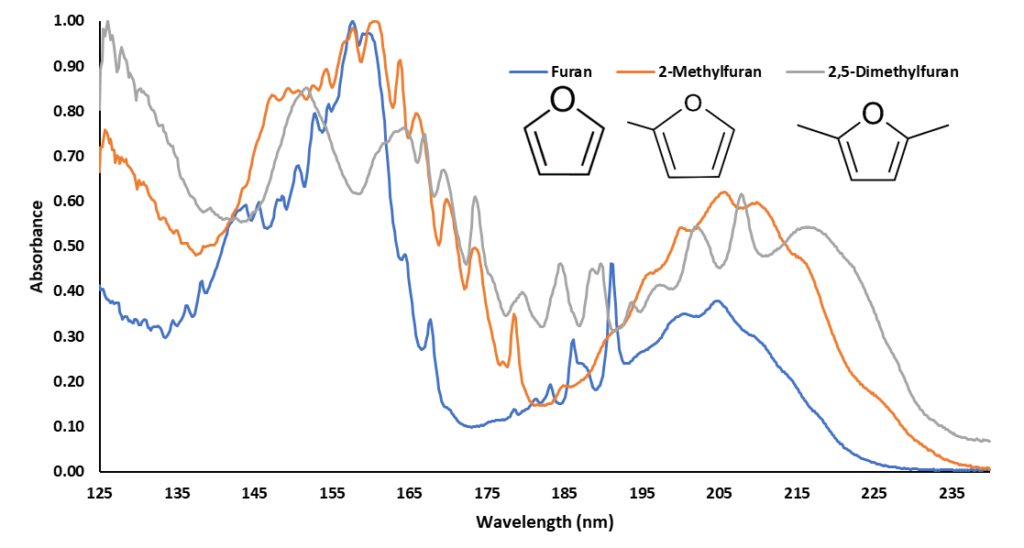
Out of curiosity, I decided to screen ground coffee with static headspace – gas chromatography – vacuum ultraviolet spectroscopy (HS-GC-VUV) for furan. Figure 1 shows a HS-GC-VUV chromatogram, rich with volatile organic compounds. Furan is present along with additional furan compounds such as 2-methylfuran and 2,5-dimethylfuran. Figure 2 shows the VUV absorbance spectra of the furan compounds, which are distinct from one another, and from other compounds in coffee, mainly due to strong absorbance features in the 180-240 nm wavelength range.

Figure 1. HS-GC-VUV chromatogram of coffee grounds, showing a subset of volatile organic peaks identified by their absorbance spectra.

Figure 2. Vacuum ultraviolet absorbance spectra of Furan, 2-Methylfuran, and 2,5-Dimethylfuran, compounds that occur in ground coffee. Their spectra are are easily discernible from one another, while also having similar features that help class them as furans.
The moral of this blog post is that GC-VUV can identify furan and a variety of other compounds present in ground coffee. So, even if you aren’t interested in furan, perhaps there are other compounds of interest that GC-VUV could detect! I hope you enjoyed this quick post and learned a thing or two. I know I did!


This is fascinating work and it looks like you got good resolution which is a bonus when dealing with matrix. Would not hurt to show absorbance spectra for #14 just to illustrate how easily those two can be differentiated using VUV. I’m curious about what stationary phase you used to get the separation? Thanks again for sharing your work.
Hi Chris! Thanks for leaving the comment. This was a fun little experiment to do. The column we used was an Rxi-624Sil (30m, 0.25mmid, 1.4umdf). Point taken about the spectral differences for peak #14. Perhaps, I’ll create a blog post highlighting VUV’s differentiation in this matrix . Hope I answered your question!