Published Ryan Schonert on August 31, 2020
In order to deliver the best possible benchtop VUV detector, we thoroughly inspect each VGA unit produced in the VUV Analytics warehouse. For the final round of factory acceptance testing, we connect the detector to a GC and run a group of test samples. These samples are designed to test various aspects of the instrument’s performance, and they can be used to diagnose any potential problems that may have been missed at the earlier stages of production. First, we verify the VGA detector’s wavelength calibration.
The VGA detector uses a charge-coupled device (CCD chip) to detect light. When light strikes the individual pixels of the CCD, each pixel releases an electrical signal that is transformed to an absorbance value at that wavelength. These pixels must be calibrated to the correct wavelength, or the spectral matching will fail. So, how do we achieve this calibration? We take advantage of unique VUV spectra!
Verifying the Calibration with Carbon Disulfide
Unlike other light spectroscopy detectors, GC-VUV takes advantage of compounds’ unique spectral fingerprints to both detect and identify sample compounds. One compound we like to use is carbon disulfide, as it has some very sharp and distinguishing features, as shown in Figure 1. If we use carbon disulfide as a guide, we can verify the calibration visually by lining up the sharp spectral “fingers” and other features throughout the spectrum, as shown in Figure 2. We can also use reference spectra like carbon disulfide to mathematically calibrate the instrument.
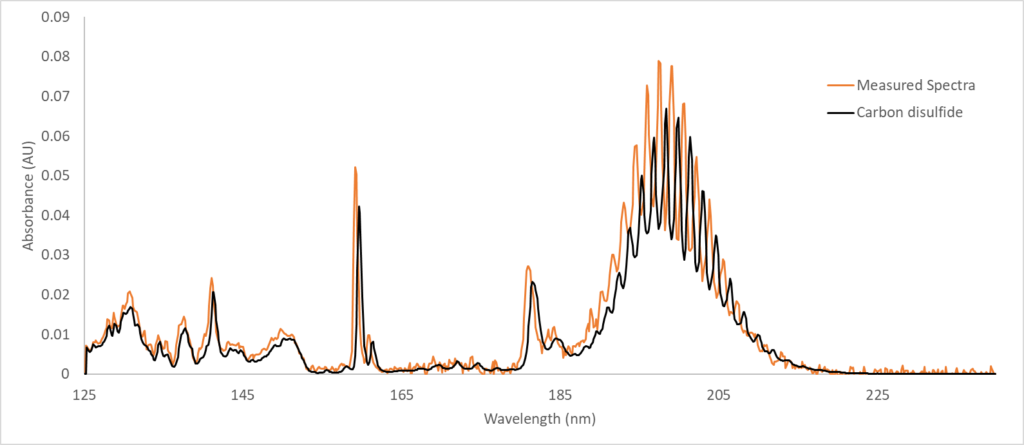
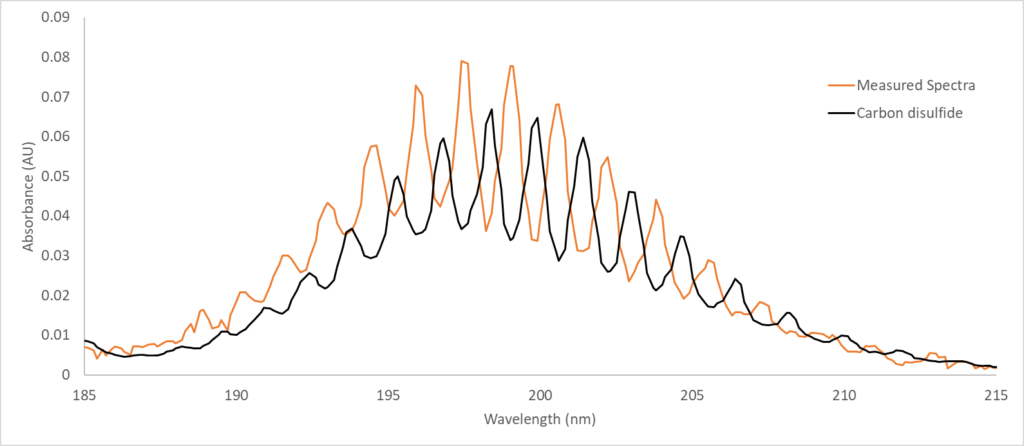
Figure 1. Comparison of the library carbon disulfide spectrum to a measured spectrum from a carbon disulfide sample (top); close-up of spectral fingers at 190-210 nm (bottom). The spectral fingers in the measured spectrum are not aligned with the library spectrum, indicating the system is not properly calibrated.
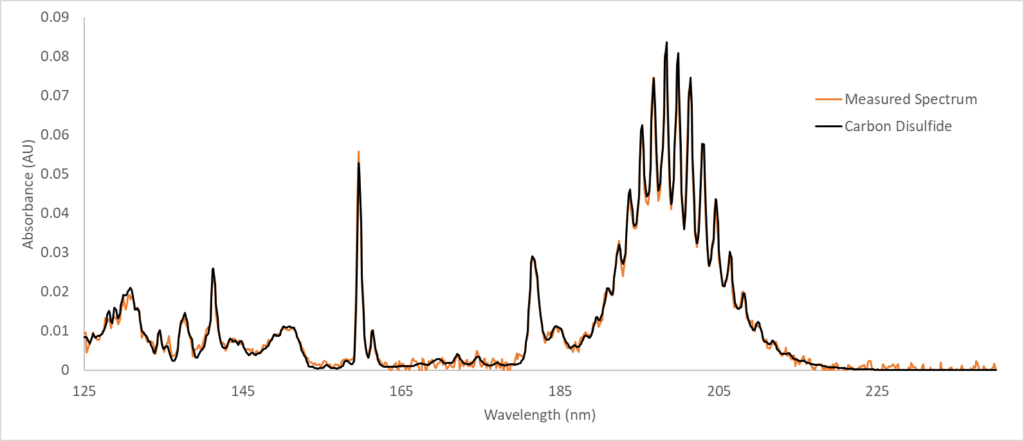
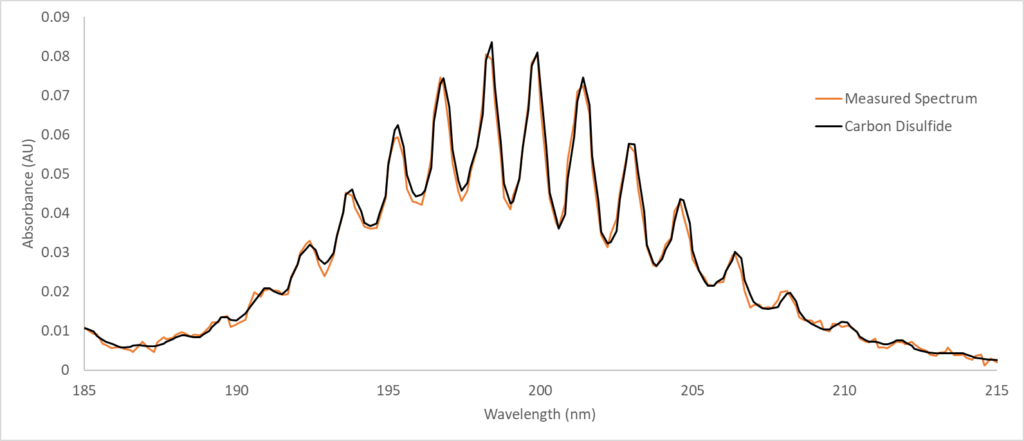
Figure 2. Comparison of the library carbon disulfide spectrum to a measured spectrum after correction (top); closeup of spectral fingers at 190-210 nm after correction (bottom). After calibration, the spectral features align closely with the library spectrum for carbon disulfide. This serves as a visual indication that the system is properly calibrated.
Once the wavelength calibration is set, the rest of the instrument qualification testing can continue.
What Happens if the Wavelength Calibration is Off?
Take a look at this example of a benzene spectrum I recently measured in Figure 3. The spectrum clearly shares the same features as the benzene library spectrum, but the spectral fit is just slightly off. To see if this subtle discrepancy would affect my ability to quantitate benzene, I tried to analyze our VUV-1 mixture, which contains benzene and several other gasoline-range hydrocarbons. To my surprise, my benzene measurement suffered quite a bit. Figure 4 shows that only a portion of the benzene peak was successfully identified.
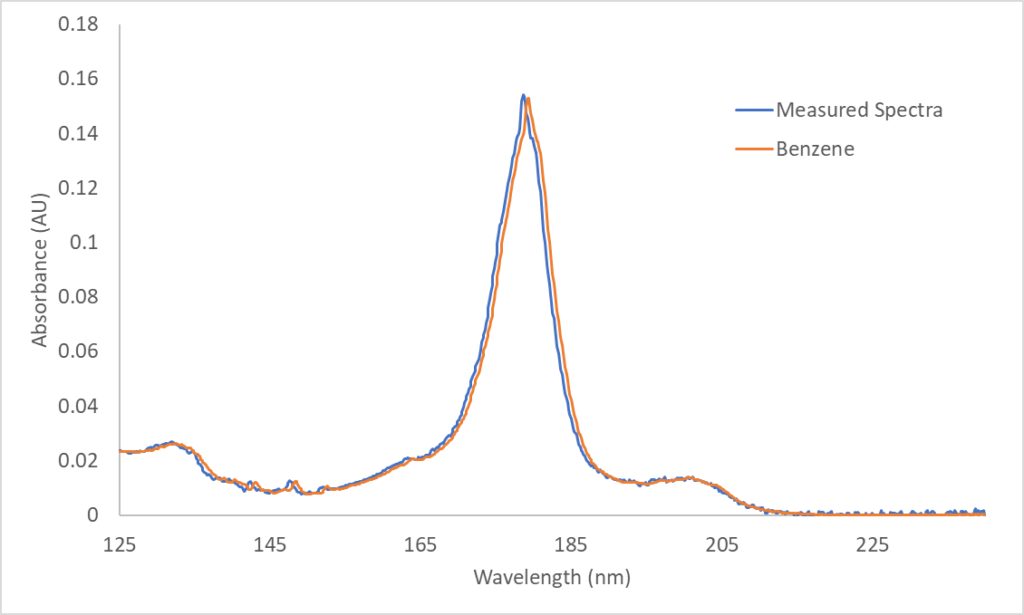
Figure 3. Comparison of the library spectrum for benzene vs. a measured spectrum of benzene in a sample. Although both spectra clearly share the same features, the calibration is slightly off. Without correction, the software may not be able to quantitate benzene properly.
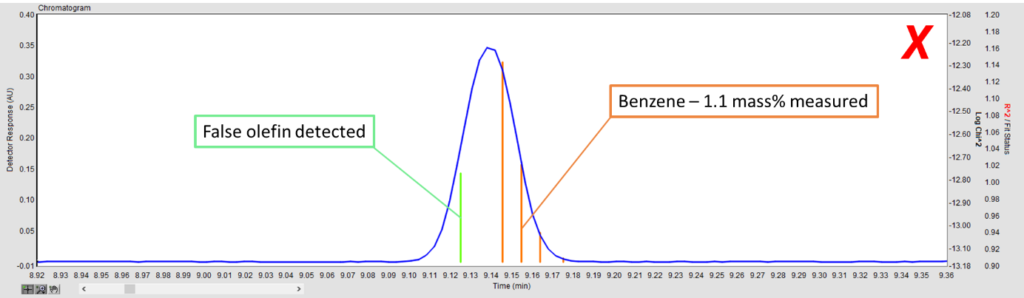
Figure 4. Analysis of a benzene peak in VUV Analyze™ Software. The orange vertical bars indicate the presence of benzene detected at various time intervals in the analysis. The subtle discrepancy in the wavelength calibration caused a large portion of the peak to be misidentified, which can be observed visually by the orange vertical bars populating less than half of the peak.
After correcting the calibration, I attempted the analysis again and got much better results. Unlike the peak in Figure 4, the peak shown in Figure 5 is fully identified as benzene.
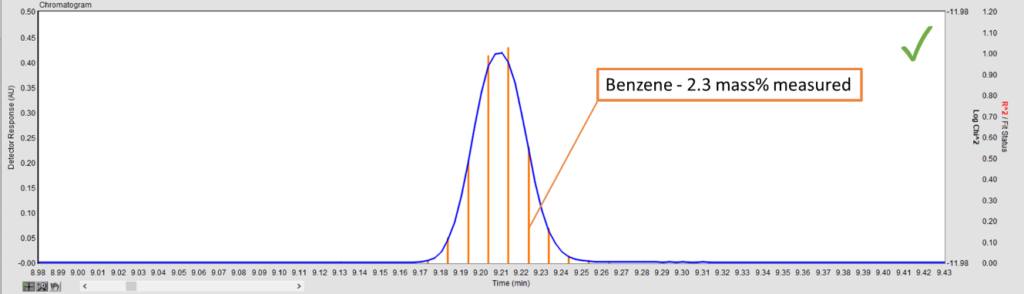
Figure 5. Proper analysis of a benzene peak in VUV Analyze™ Software. Unlike the peak in Figure 4, the entire peak has been identified as benzene at each time interval of the analysis.
What does all of this mean? Well, it means that the instrument is sensitive to even subtle differences in absorbance spectra, and this is why we’re able to perform spectral deconvolution so successfully! With the proper wavelength calibration, the VGA detector can spot the spectral differences of coeluting compounds, even if those differences are minor. This is why we make sure each VGA detector is well-calibrated before use, and we double-check the calibration during installation.
Calibrating the wavelength is only the first step in the Instrument Qualification process. Keep an eye out for the next steps in future blog posts!
Author

Ryan Schonert
Ryan Schonert is currently an Application Scientist for VUV Analytics. Prior to joining VUV Analytics, Ryan performed research on the extraction and characterization of additives in smokeless powders using GC-MS and SEM-EDS. He earned a B.S. in Chemistry from Illinois Wesleyan University and an M.P.S. in Forensic Science from the Pennsylvania State University.
Related Reading
VGA Instrument Qualification – Complex Compositional Analysis & Final Checks
Ryan Schonert
This blog discusses the final steps in instrument qualification by using test samples to check…
Read More >
Obtaining Quality VUV Spectra using VUVision Software
Chris Hernandez
This blog outlines what must be considered when adding a compound to your user library…
Read More >
Standardizing your ASTM D8071 Analysis
Chris Cook
In this blog, we cover all standards used in our ASTM D8071 application, how often…
Read More >


Leave a Reply